
The Electrical System - PowerPoint PPT Presentation
1 / 60
Title:
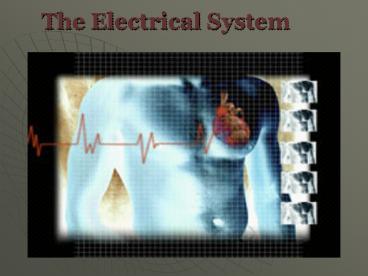
The Electrical System
Description:
The normal pattern of muscle contraction begins in the upper chambers (atria) ... ECG or EKG (Electrocardiogram) Measure heart rate. Look for arrhythmias ... – PowerPoint PPT presentation
Number of Views:265
Avg rating:3.0/5.0
Title: The Electrical System
1
The Electrical System
2
The Electrical System
- The pumping of the heart muscle generates a
pulse, or heartbeat. - The normal pattern of muscle contraction begins
in the upper chambers (atria), which pump blood
into the lower chambers (ventricles).
3
The Electrical System
- The ventricles pump blood to the body and lungs.
- This coordinated action occurs because the heart
is "wired" to send electrical signals that tell
the chambers of the heart when to contract.
4
The Electrical System
- Your heartbeat is able to speed up and slow down
because it is wired with electrical tissue. - Your heart also has built-in "pacemakers" that
are like electrical outlets.
5
The Electrical System
- The electrical system of the heart triggers the
heartbeat. - The pacemakers and the wiring that run through
your heart also coordinate contractions in the
upper chambers and lower chambers, which makes
the heartbeat more powerful so it can do its job
effectively.
6
How is the Heart Wired?
- We normally have our own pacemakers that tell the
heart when to beat. - The master pacemaker is located in the atrium
(upper chamber). - It acts like a spark plug that fires in a
regular, rhythmic pattern to regulate the heart's
rhythm.
7
How is the Heart Wired?
- This "spark plug" is called the sinoatrial (SA),
or sinus node. - It sends signals to the rest of the heart so the
muscles will contract. - First, the atrium contracts.
- The electrical signal from the sinus node spreads
through the atria.
8
How is the Heart Wired?
- Next, the electrical signal travels to the area
that connects the atria with the ventricles. - This electrical connection is critical.
- Without it, the signal would never reach the
ventricles, the major pumping chambers of the
heart.
9
How is the Heart Wired?
- The first structure it reaches is another natural
pacemaker called the atrioventricular (AV node). - A structure called the bundle of His emerges from
the AV node and divides into thin, wire-like
structures called bundle branches that extend
into the right and left ventricles.
10
How is the Heart Wired?
- The electrical signal travels down the bundle
branches to thin filaments known as Purkinje
fibers. - These fibers distribute the electrical impulse to
the muscles of the ventricles, causing them to
contract and pump blood into the arteries.
11
(No Transcript)
12
When Your Heart Doesn't Work as It Should
- The S-A node doesn't produce the right number of
signals. - Another part of the heart takes over as the
natural pacemaker. - The electrical pathways are interrupted.
13
When Your Heart Doesn't Work as It Should
- Slow Arrhythmias When the heart beats too
slowly it's called bradycardia (brady slow,
cardia heart). - Slow arrhythmias can be a problem because they
cause the oxygen- and nutrient-rich blood to
travel more slowly to your organs and other
tissues. - Your body may not receive enough oxygen and
nutrients to function properly.
14
When Your Heart Doesn't Work as It Should
- Fast Arrhythmias When the heart beats too fast
it's called tachycardia (tachy fast, cardia
heart). - During tachycardia the heart isn't able to pump
blood to the body as well as it should. - Fast rhythms in the upper chambers may not be
life-threatening in themselves. - But they may contribute to other problems that
are serious. - Fast arrhythmias in the lower chambers, the
ventricles, can be dangerous and even fatal.
15
What Causes These Problems?
- Heart disease causes changes in the heart tissue.
- Aging of the heart muscle can also change the
heart tissue. - Physical problems, such as diabetes, smoking, and
excessive alcohol or drug use, can affect the
heart tissue. - There could be an inherited heart problem.
- There is evidence of heart failure or a heart
attack.
16
Tests for the Conduction System
- ECG or EKG (Electrocardiogram)
- Measure heart rate
- Look for arrhythmias
- Identify enlargement of the heart's chambers
- Help diagnose whether you've had a heart attack
17
- The ECG or EKG, directly measures microvoltages
in the heart muscle (myocardium) occurring over
specific periods of time in a heartbeat,
otherwise known as a cardiac impulse. - With each heartbeat, electrical currents called
action potentials, measured in millivolts (mV),
travel through a conducting system in the heart.
18
- The potentials originate in a sinoatrial (SA)
node which lies in the entrance chamber of the
heart, called the right atrium. - These currents also diffuse through tissues
surrounding the heart whereby they reach the
skin. - There they are picked up by external electrodes
which are placed at specific positions on the
skin.
19
- They are in turn sent through leads to an
electrocardiograph. - A pen records the transduced electrical events
onto special paper. - The paper is ruled into mV against time and it
provides the reader with a so-called rhythm
strip.
20
- This is a non-invasive method to used evaluate
the electrical counterparts of the myocardial
activity in any series of heart beats. - Careful observation of the records for any
deviations in the expected times, shapes, and
voltages of the impulses in the cycles gives the
observer information that is of significant
diagnostic value, especially for human medicine.
21
- The normal rhythm is called a sinus rhythm if the
potentials begin in the sinoatrial (SA) node.
22
- A cardiac cycle has a phase of activity called
systole followed by a resting phase called
diastole. - In systole, the muscle cell membranes, each
called a sarcolemma, allow charged sodium
particles to enter the cells while charged
potassium particles exit.
23
- These processes of membrane transfer in systole
are defined as polarization. - Electrical signals are generated and this is the
phase of excitability. - The currents travel immediately to all cardiac
cells through the mediation of end-to-end
high-conduction connectors termed intercalated
disks.
24
- The potentials last for 200 to 300 milliseconds.
- In the subsequent diastolic phase, repolarization
occurs. - This is a period of oxidative restoration of
energy sources needed to drive the processes. - Sodium is actively pumped out of the fiber while
potassium diffuses in. - Calcium, which is needed to energize the force of
the heart, is transported back to canals called
endoplasmic reticula in the cell cytoplasm.
25
- The action potentials travel from the superior
part of the heart called the base to the inferior
part called the apex. - In the human four-chambered heart, a pacemaker,
the SA node, is the first cardiac area to be
excited because sodium and potassium interchange
and energize both right and left atria.
26
- The impulses then pass downward to an
atrioventricular (AV) node in the lower right
atrium where their velocity is slowed, whereupon
they are transmitted to a conducting system
called the bundle of His. - The bundle contains Purkinje fibers that transmit
the impulses to the outer aspects of the right
and left ventricular myocardium.
27
- In turn, they travel into the entire ventricular
muscles by a slow process of diffusion. - Repolarization of the myocardial cells takes
place in a reverse direction to that of
depolarization, but does not utilize the bundle
of His.
28
(No Transcript)
29
Cardiac Cycle
- The events that occur from the beginning of one
heartbeat to the beginning of the next. - Consists of ventricular diastole (relxation) and
ventricular systole (contraction)
30
Diastole
- During diastole, blood flows from the atria
through the open tricuspid and mitral valves into
the relaxed ventricles. - The aortic and pulmonic valves are closed.
- 75 of blood flow is passive
31
Systole
- During ventricular systole the mitral and
tricuspid valves are closed. - The relaxed atria fill with blood. A ventricular
pressure rises, the aortic and pulmonic valves
open. - The ventricle contract, and blood is ejected into
the pulmonic and systemic circulation.
32
Cardiac Output
- Is the amount of blood the left ventricle pumps
into the aorta per minute. - Is measured by multiplying heart rate times
stroke volume. - Stroke volume refers to the amount of blood
ejected with each ventricular contraction and is
usually about 70 mls.
33
Cardiac Output
- Normal CO is 4 to 8 L/min.
- The heart pumps only as much blood as the body
requires, based on metabolic requirements.
34
Cardiac Output
- Three factors determines stroke volume
- Preload
- Afterload
- Myocardial contractility.
35
Preload
- Is the degree of stretch or tension on the muscle
fibers when they begin to contract.. - Its usually considered to be the end-diastolic
pressure when the ventricl has filled
36
Afterload
- Is the load (or amount of pressure) the left
ventricle must work against to eject blood during
systole. - It corresponds to systolic pressure.
- The greater this resistance is, the greater the
hearts workload.
37
Myocardial contractility
- Is the ventricles ability to contract, which is
determined by the degree of muscle fiber stretch
at the end of diastoe. - The more the muscle fibers stretch during
ventricular filling, up to an optimal length, the
more forecful the contration.
38
Autonomic innervations of the heart
- Two branches of the autonomic nervous system
supply the heart. - Sympathetic nervous system
- Parasympathetic nervous system
39
Sympathetic
- Innervate all the areas of the heart
- Nerve stiulation causes the release of
norepinephrine, which increases the heart rate by
increasing SA node discharge, accelerates AV noe
conduction time, and increases the force of
myocardial contraction and cardiac output.
40
Parasympathetic
- Vagal stimulation causes the release of
acetylcholine, which produces the opposite
effects. - The rate of SA node dischare is decrease, thus
slowing hear rate and conduction through the AV
node and reducing cardiac output.
41
(No Transcript)
42
Depolarization and Repolarization
- As impulses are transmitted, cardiac cells
undergo cycles of depolarization and
repolarization. - Cardiac cells at rest are considered polarized,
meaning that no electrical activity takes place.
43
- Cell membranes separate different concentrations
of ion, such as sodium and potassium and create a
more negative charge inside the cell. - This is called resting potential
- After a stimulus occurs, ions cross the cell
membrane and cause an action potential or cell
depolarization. - When a cells fully depolarized it attempts to
return to its resting state in a process called
repolarization. - Electrical charges in the cell reverse and return
to normal.
44
Electrical Activity
- Of the heart is represented on an ECG.
- ECG represent only electrical activity not the
mechanical activity or actual pumping of the
heart.
45
How to Read an EKG Strip
- EKG paper is a grid where time is measured along
the horizontal axis. - Each small square is 1 mm in length and
represents 0.04 seconds. - Each larger square is 5 mm in length and
represents 0.2 seconds.
46
How to Read an EKG Strip
- Voltage is measured along the vertical axis.
- 10 mm is equal to 1mV in voltage.
- The diagram on the next slide illustrates the
configuration of EKG graph paper and where to
measure the components of the EKG wave form
47
(No Transcript)
48
Heart rate can be easily calculated from the EKG
strip
- When the rhythm is regular, the heart rate is 300
divided by the number of large squares between
the QRS complexes. - For example, if there are 4 large squares between
regular QRS complexes, the heart rate is 75
(300/475).
49
Heart rate can be easily calculated from the EKG
strip
- The second method can be used with an irregular
rhythm to estimate the rate. Count the number of
R waves in a 6 second strip and multiply by 10. - For example, if there are 7 R waves in a 6 second
strip, the heart rate is 70 (7x1070).
50
P wave
- Indicates atrial depolarization, or
contraction of the atrium. - Location precedes the QRS complex
- Amplitude (height) is no more than 3 mm
- Duration 0.06 to 0.12 seconds
- Usually rounded and smooth
51
PR Interval
- Tracks the atrial impulse from the atria through
the AV node, bundle of His and right and left
bundle branches. - Location from the beginning of the P wave to the
beginning of the QRS complex. - Duration 0.12 seconds to 0.20 seconds
- Short intervals indicate that the impulse
originated somewhere other than the SA node.
52
QRS complex
- Indicates ventricular depolarization, or
contraction of the ventricles. - Location follows the PR interval
- Amplitude 5 to 30 mm high, but differs with each
lead used. - Duration 0.06 to 0.10 seconds or half of the PR
interval measured from the beginning of the Q
wave to the end of the S wave - R waves are deflected positively and the Q and S
waves are negative
53
ST Segment
- Represents the end of ventricular conduction or
depolarization and the beginning of ventricular
recover or repolariztion. - Location extends from the S wave to the
beginning of the T wave. - Deflection usually on the baseline may vary from
-0.5 to 1.0 mm. - A change in the ST segment may indicate
myocardial injury or ischemia.
54
T wave
- Indicates ventricular repolarization
- Location follows the ST segment
- Amplitude 0.5 mm in standard leads and 10 mm in
precordial leads - Rounded and smooth
55
ST segment
- Represents the end of ventricular conduction or
depolarization and the beginning of ventricular
recovery or repolariztion. - Normally not depressed more than 0.5 mm
56
QT interval
- Indicates repolarization time
- Location extends from the beginning of the QRS
complex to the end of the T wave - General rule duration is less than half the
preceding R-R interval. - Duration varies according to age, gender and
heart rate. From 0.36 to 0.44 seconds
57
Paper and Pencil method of measuring Rhythm
- Place the ECG strip on a flat surface.
- Position the straight edge of a piece of paper
along the strips baseline. - Move the paper up slightly so that the straight
edge is near the peak of the R wave. - Mark the paper at the R waves of 2 consecutive
QRS complexes. This distance is the R-R interval.
58
- Move the paper across the strip lining up the two
marks with succeeding R-R intervals. If the
distance for each R-R interval is the same, the
ventricular rhythm is REGULAR. - If the distances varies the RHYTHIM ins
irregular. - The same can be done using the distance between
the P waves to determine atrial rhythm
59
- Building 1 suite313
- Dr. Sneider
- Dec 2nd at 215
60
- http//usasam.amedd.army.mil/_fm_course/Study/Unde
rstandingECG.pdf
Recommended
CrystalGraphics Presentations


