
Dust Emission in SW United States - PowerPoint PPT Presentation
1 / 39
Title:
Dust Emission in SW United States
Description:
Dust Emission in SW United States – PowerPoint PPT presentation
Number of Views:47
Avg rating:3.0/5.0
Title: Dust Emission in SW United States
1
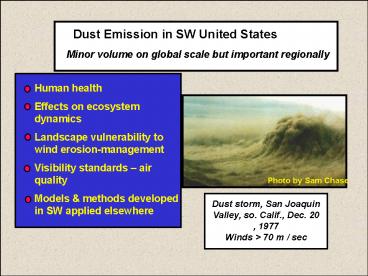
Dust Emission in SW United States
Minor volume on global scale but important
regionally
Human health Effects on ecosystem dynamics
Landscape vulnerability to wind
erosion-management Visibility standards air
quality Models methods developed in SW applied
elsewhere
Photo by Sam Chase
Dust storm, San Joaquin Valley, so. Calif., Dec.
20 , 1977 Winds gt 70 m / sec
2
Research on Southwestern Dust
- Identify dust sources -- past, current, future
- Understand dust generation -- processes
conditions (interannual climatic variability) - Assess health effects dusts that contain soil
pathogens metals in playa dust - How metals become incorporated into dust
bioaccessibility - Assess wind-erosion effects and vulnerability
related to land use - Understand role of dust in ecosystem dynamics
3
Climatic Controls on wind dust in the Southwest
Subtropical high-pressure ridge (low ppt high
temps) Aridity High temps rates of
evapotranspiration Rain shadow effects of
ranges Vegetation dynamics Seasonal wind
patterns Topography Influences spatial
variability of climate Effects on wind Sediment
availability (hydrologic processes)
Meridional (trough-ridge) pattern S. Arm of
split flow (El Nino winter) Typical winter flow
(700 mb jet) Monsoon storm paths (summer) Santa
Ana winds (foehn or chinook type) Oct. Feb.
1000-500 hPa thickness
4
Dust storm over Colorado Kansas, April 8, 1999
NOAA
5
Dust front approaching Lubbock, Texas
Ahead of Spring convective storm, Oct. 3,
1983 most dust likely agricultural
6
Dust storm, Chihuahua, Mex. April 6, 2001 GOES 8
Poorly understood sources in the Chihuahuan
Desert contribute large pulses of dust to central
and eastern US and Canada
7
(No Transcript)
8
Owens (dry) Lake --a major source of SW mineral
dust (7 of PM10 in US) enriched in alkaline
salts and trace metals Current conditions caused
by water diversion beginning 1913
Two common dust sources in the Mojave Desert
Photo by W. Cox, GBUAPCD Feb. 21, 1985
Dust from Ft. Irwin overrides mountains on
eastern edge of base
9
Dust plumes off S. Calif. Santa Ana
windstorm Jan. 6, 2003 (NASA Landsat/ERTS-1)
Dust plumes from agricultural fields, SW
Utah April 15, 2002 (NASA Landsat)
10
Main dust-emitting area of Bodele Depression
11
Chavez et al., USGS
12
Chavez et al., USGS
13
Anatomy of a CLIM-MET Weather Station
14
Monitoring Landscape Ecosystem Change Using
Satellite Images and Change Detection Methods
Vulnerability to wind erosion
Physical biologic properties/characteristics of
surfaces (roughness, clasts, crust)
Vegetation change
Land-use patterns
METHODS
Landsat / MASTER / AirSar / Airborne digital
camera / Lidar
Ground-based monitoring
Mojave National Preserve
Chavez et al., USGS
15
Remote digital camera monitoring of dust events
Digital Airborne Imaging System
Mojave Desert
Devils Playground/Soda Lake
Soda (dry) Lake
Collects high spatial temporal images
Three spectral bands Spatial res 0.3 m 0.15
0.075 m gt30,000 images per survey Rapid
deployment
upper blue-lower green red near IR
Zzyzx Mountain
16
Vegetation (red) after dry period, March 2000
Mojave Desert
Mojave Desert
Vegetation (red) after wet period, March, 2001
Chavez et al., USGS
17
Landsat image, central Mojave Desert, April 1992,
during wet Spring
Soda Lake
Balch
Landsat image, central Mojave Desert, June 1997,
following dry Spring
Kelso Dunes
18
Reflectivity-change image generated from
difference analysis between Landsat images,
April 1992 June 1997
Chavez et al., USGS
19
14.5-17
17-19
19-21
gt21
lt14.5
TM reflectance calibrated against direct spectral
radiometer reflectance in the field for different
soil and veg settings
20
Effects of dynamic vegetation on dust emission
Key Goal Produce maps of shear force of wind on
surface for different wind scenarios (linking
ABLs and wind-erosion models)
Map threshold shear velocity ratio
(Rtubare/ucovered)
Direct measurement of roughness heights (Zo)
Must have spatial distribution of roughness
heights -- Zo -- from vegetation and other
roughness elements gtDirect wind
measurement gtGround measurements of plants
21
Extending ground-based measurements to landscape
via airborne surveys over vegetation zones and
geologic surfaces
Color-IR near Clim-met station 0.2m resolution
MASTER flight lines -- 3-band color IR 0.2-m
resolution 50-band MODIS ASTER Airborne
Simulator Data 5-m resolution
Ratio of Near-IR to green bands from color-IR
Pixels show outer parts of large shrubs
vegetation complexes and locations of small
shrubs.
22
Surficial geologic map of the Mojave National
Preserve
- Process and soils
- 6 process types
- 5 ages for deposits
- 10 bedrock types
- 2 erosional systems
Scaling upapply Zo (MASTER data) assoc w/ veg
surfaces to the region through veg maps ages of
geologic surfaces
D. Miller et al.
K. Thomas et al.
23
Different kinds of veg data-- 1500 plots (1240
plots are 1 km2 1 TM pixel) 5000 point
occurrences of veg types
Species composition Density Height Estimated
cover (individual species) Crust
assessments Particle-size classes Annual-plant
assessment (Bromus plots)
K. Thomas, J. Belnap, and others, USGS
24
Balch station 2000-2002
Precipitation Surface Stability (particle
impacts)
8
Monthly sensit activity Proxy for dust
generation
6
Particle impacts / month x 106
2
0
40
Monthly precipitation
Oct. 28, 2000
Changes in vegetation
20
Millimeters
0
Jan
Jan
Jan
April 30, 2001
2000
2001
2002
25
2000
Wind Strength Surface Stability (particle
impacts) Balch
1000
2001
500
2002
Wind 2000 gt 2002 gt 2001
0
No. 5-min periods with wind speed gt 7 m/s
1000
8
Particle impacts 2000 track wind 2001
decrease, then flat 2002 increase
Particle impacts x106
4
500
0
0
Feb
Mar
Apr
May
Jun
Jul
Jan
26
Interannual Variations in Dust Generation Central
Mojave Desert
Precipitation control on vegetation cover
(roughness shrubs annual grass)
Land surface has memory old, dead veg may
stabilize surface
Wind but has variable control effects can be
attenuated by vegetation cover. Yearly variations
Sediment supply (silt sand) System not
monitored long enough to observe big changes
but
Aug. 2003
27
Regional wind storms, April, 2002
Weather patterns
Dust sources and transport pathways
Effects on air quality
April 15, 2002
28
Weather patterns
00 UTC Thurs Apr 18, 2002
warm thick
Pressure Field
High winds April 17 18
cold thin
Balch
1000-500 hPa thickness
Hourly-avg. gt 6 m/s for 12 hrs
Peak gusts 10-14 m/s
29
GOES-10 April 15, 2002
Pacific Ocean
Las Vegas
30
GOES-10 April 15, 2002
Pacific Ocean
31
GOES-10 April 15, 2002
Pacific Ocean
32
Las Vegas dust storm April 15, 2002
PM10 values, NE Valley area
Dust in Las Vegas. April 15, 2002 Windstorm was
the strongest and most widespread in a decade.
Unhealthy levels of PM10 dust were reported at
monitoring stations.
Next step examine hospital records for mortality
33
Toxic metals in dust from Owens (dry) Lake, CA
Dust from Owens Lake
Collaborative research among USGS Desert Research
Inst., Texas Tech Univ.
Mapping dust-emission potential
Mapping trace-element contents of fine-grained
mineral and soluble fractions, deposited dust,
playa sediment, aerosol samples collected from
dust storms.
Photo by W. Cox, GBUAPCD
Mineral dusts Enriched in elements derived
from evaporation of alkaline lake water and
shallow groundwater (Na, Mg, Sr, Li, B) Contain
elevated As, Cr, Cu, Mo, Ni, Pb, Sb, Th, U,
Se Small, many lt 1 mm
Overlaying maps to estimate potential flux of
toxic metals
Medical geology research on the effects of dust
on human health and wildlife health (solubility
bioavailability)
34
Sources of groundwater to a playa basin
Facies mineralogy in a playa basin
- Channeled flow
- Overland flow
- Hydrothermal fluids
- Formation water
- Meteoric groundwater
- Direct precipitation
Closed basin brine evolution based on computer
modeling field observation (after Eugster
Hardie, 1978)
Rosen (1994) GSA Spec. Paper 289
35
Ash Meadows
Jan 03
Jan 03
Franklin Playa
Jan 03
Sept 03
Mesquite (dry) Lake
May 03
36
Sept. 2003
Sept. 2003
Franklin Playa surfaces
Czarnecki, J.B., 1997, Geohydrology and
evapotranspiration at Franklin Lake playa, Inyo
County, California USGS Water Supply Paper, 2377.
37
Difference in altitude between potentiometric
surface and land surface at Franklin Lake playa
Czarnecki, J.B., 1997, Geohydrology and
evapotranspiration at Franklin Lake playa, Inyo
County, California USGS Water Supply Paper, 2377.
38
Documenting rapidly changing conditions of
sediment and dust-emission potential
Hydrologically dynamic playas
- Wind, temp., soil moisture stations
39
Value of SW dust studies Leads to recognition of
hazards Improves quantification of dust flux,
impacts, forecasts Window into future dust
activities elsewhere, because SW is dynamic
complex (veg, climate, human influences,
groundwater)
Bodele depression, Chad The Mother of all Dust
Sources