
PHARMACOKINETICS - PowerPoint PPT Presentation
1 / 34
Title:
PHARMACOKINETICS
Description:
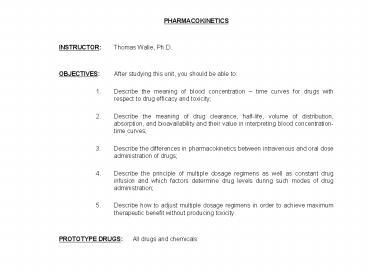
OBJECTIVES: After studying this unit, you should be able to: ... 5. Describe how to adjust multiple dosage regimens in order to achieve maximum ... – PowerPoint PPT presentation
Number of Views:179
Avg rating:3.0/5.0
Title: PHARMACOKINETICS
1
- PHARMACOKINETICS
- INSTRUCTOR Thomas Walle, Ph.D.
- OBJECTIVES After studying this unit, you should
be able to - 1. Describe the meaning of blood concentration
time curves for drugs with respect to drug
efficacy and toxicity - 2. Describe the meaning of drug clearance,
half-life, volume of distribution, absorption,
and bioavailability and their value in
interpreting blood concentration-time curves - 3. Describe the differences in pharmacokinetics
between intravenous and oral dose administration
of drugs - 4. Describe the principle of multiple dosage
regimens as well as constant drug infusion and
which factors determine drug levels during such
modes of drug administration - 5. Describe how to adjust multiple dosage
regimens in order to achieve maximum therapeutic
benefit without producing toxicity.
2
- PHARMACOKINETICS
- INSTRUCTOR Thomas Walle, Ph.D.
- OBJECTIVES After studying this unit, you should
be able to - 1. Describe the meaning of blood concentration
time curves for drugs with respect to drug
efficacy and toxicity - 2. Describe the meaning of drug clearance,
half-life, volume of distribution, absorption,
and bioavailability and their value in
interpreting blood concentration-time curves - 3. Describe the differences in pharmacokinetics
between intravenous and oral dose administration
of drugs - 4. Describe the principle of multiple dosage
regimens as well as constant drug infusion and
which factors determine drug levels during such
modes of drug administration - 5. Describe how to adjust multiple dosage
regimens in order to achieve maximum therapeutic
benefit without producing toxicity.
1 Become familiar with blood concentration-time
curves to optimize therapeutic benefits.
3
Blood Levels of Drugs vs. Therapeutic
Effectiveness and Toxicity
A. Minimum Effective Level B. 1) Minimum Toxic L
evel 2) Maximum Effective Level Without Toxicity
C. Therapeutic Range
4
Blood Levels of Drugs vs. Therapeutic
Effectiveness and Toxicity
Note! All drugs have toxicity extreme! Chemoth
erapeutic
drugs
A. Minimum Effective Level B. 1) Minimum Toxic L
evel 2) Maximum Effective Level Without Toxicity
C. Therapeutic Range
KEY
5
A. Desired CurveB. Undesirable Curve -
ToxicityC. Undesirable Curve - No Therapeutic
Effect
6
A. Desired CurveB. Undesirable Curve -
ToxicityC. Undesirable Curve - No Therapeutic
Effect
Onset Duration Variability
7
D. Intravenous Bolus - ToxicityE. Intravenous
Infusion - Desired Curve
8
D. Intravenous Bolus - ToxicityE. Intravenous
Infusion - Desired Curve
Onset Duration Variability
9
- Therapeutic Blood Levels for Various Drugs
- Drug Disease Therapeutic range
(mg/liter) - __________________________________________________
__________________________ - Propranolol Angina 0.02 - 0.20 10-fold
- Salicylic acid Aches and pain 20-100 5-fold
- Rheumatic fever 200-400 2-fold
- Warfarin Thromboembolic diseases 1-4 4-fold
- Digoxin Cardiac dysfunction 0.0008 -
0.0016 2-fold - Phenytoin Epilepsy 10 - 20 2-fold
- __________________________________________________
__________________________
10
- Therapeutic Blood Levels for Various Drugs
- Drug Disease Therapeutic range
(mg/liter) - __________________________________________________
__________________________ - Propranolol Angina 0.02 - 0.20 10-fold
- Salicylic acid Aches and pain 20-100 5-fold
- Rheumatic fever 200-400 2-fold
- Warfarin Thromboembolic diseases 1-4 4-fold
- Digoxin Cardiac dysfunction 0.0008 -
0.0016 2-fold - Phenytoin Epilepsy 10 - 20 2-fold
- __________________________________________________
__________________________
Difficult to deal with therapeutically.
11
Variability in Mean Drug Blood Levels for the
Anticonvulsant Phenytoin (Diphenylhydantoin) in
the General Population Variability due to
multiple factors (Genetic, Environmental, Other
Drugs, Disease).
12
Variability in Mean Drug Blood Levels for the
Anticonvulsant Phenytoin (Diphenylhydantoin) in
the General Population Variability due to
multiple factors (Genetic, Environmental, Other
Drugs, Disease).
Severe to mild toxicities
Therapeutic failure
13
Drug Blood Level - Time CurvesA. I.V. Doses
- For therapeutic doses all elimination processes
(renal, hepatic) are generally 1st order, i.e.
the rate of elimination is proportional to the
amount present
log Cb logCb0 ?t/2.3 ? elimination rate c
onstant
14
Drug Blood Level - Time CurvesA. I.V. Doses
Physiological model
- For therapeutic doses all elimination processes
(renal, hepatic) are generally 1st order, i.e.
the rate of elimination is proportional to the
amount present
log Cb logCb0 ?t/2.3 ? elimination rate c
onstant
15
Zero order elimination also exists, i.e. the rate
of elimination is constant, independent of the
amount present
- Elimination mechanism saturated. For ethanol and
for drugs in overdose situations.
16
Zero order elimination also exists, i.e. the rate
of elimination is constant, independent of the
amount present
Much slower than 1st order
- Elimination mechanism saturated. For ethanol and
for drugs in overdose situations.
17
What information can we obtain from blood
concentration-time curves?
18
- Clearance (CL) measure of the efficiency by
which the body removes the drug (concept borrowed
from physiology, i.e. organ clearance) - AUC area under concentration-time curve,
expressed in concentration x time, e.g. ng/ml x
hr - CL is expressed in ml/min
- Ex. CLRenal Atenolol 100 ml/min - GFR
- GFR 125 ml/min Methicillin 400 ml/min -
Secretion - Ex. CLHepatic Propranolol 1200 ml/min - high
CL - QH 1500 ml/min Diazepam 30
ml/min - low CL
19
- Clearance (CL) measure of the efficiency by
which the body removes the drug (concept borrowed
from physiology, i.e. organ clearance) - AUC area under concentration-time curve,
expressed in concentration x time, e.g. ng/ml x
hr - CL is expressed in ml/min
- Ex. CLRenal Atenolol 100 ml/min - GFR
- GFR 125 ml/min Methicillin 400 ml/min -
Secretion - Ex. CLHepatic Propranolol 1200 ml/min - high
CL - QH 1500 ml/min Diazepam 30
ml/min - low CL
Why this high?
Why this low?
20
Half-life (t1/2) time it takes for drug
concentrations to decrease by one half. Ex.
Atenolol (6 hr), Methicillin (0.8 hr),
Propranolol (3 hr), Diazepam (43 hr)
21
- Volume of Distribution (Vd) estimate of tissue
distribution. - A larger Vd means greater distribution into
tissues and therefore less drug in the blood. - Vd is expressed in liters or liters/kg.
- Ex. Atenolol (0.55 L/kg), Methicillin (0.43
L/kg), Propranolol (3.9 L/kg), Diazepam (1.1
L/kg)
22
- Relationship between these parameters
- How do you use CL, t1/2 and Vd? - For
quantitative expression of the disposition of a
drug.
23
- Relationship between these parameters
- How do you use CL, t1/2 and Vd? - For
quantitative expression of the disposition of a
drug.
Important! Does not say that Vd is related to CL
!
24
- B. Oral Doses
What are the differences compared to i.v. doses?
1. Shape of the curve due to the transit time i
nvolving gut absorption.
For equal doses (Do Div), the AUCo AUCiv.
25
- B. Oral Doses
What are the differences compared to i.v. doses?
1. Shape of the curve due to the transit time i
nvolving gut absorption.
Involves few drugs, e.g., acetaminophen (Tylenol)
For equal doses (Do Div), the AUCo AUCiv.
26
- 2. Blood concentrations are lower after oral than
after i.v. doses. This is commonly the case
This could be due to a) Incomplete gut absorpt
ion i. Complex formation (drugdrug interaction)
ii. Membrane efflux pumps
27
- 2. Blood concentrations are lower after oral than
after i.v. doses. This is commonly the case
Yes!
This could be due to a) Incomplete gut absorpt
ion i. Complex formation (drugdrug interaction)
ii. Membrane efflux pumps
28
- b) Metabolism before the drug reaches the
systemic circulation, i.e. presystemic or
first-pass metabolism.
i. Gut metabolism ii. Liver metabolism
29
- b) Metabolism before the drug reaches the
systemic circulation, i.e. presystemic or
first-pass metabolism.
Critically important for most drugs
i. Gut metabolism ii. Liver metabolism
30
Oral Bioavailability (F)
- F fraction of dose reaching systemic
circulation - F 100 for i.v. Dose
- AUCo Div
- F 100
- AUCiv Do
31
Oral Bioavailability (F)
antihypertensive drug propranolol
- F fraction of dose reaching systemic
circulation - F 100 for i.v. Dose
- AUCo Div
- F 100
- AUCiv Do
32
- The half-life is determined as after i.v. doses
from the slope and is identical to that after
i.v. doses. - Has to be calculated after the absorption has
occurred! - The volume of distribution cannot be determined
after oral doses Only after i.v. Doses
33
3. Drug metabolite concentrations are higher
after oral than after i.v. doses
What are the clinical implications?
34
3. Drug metabolite concentrations are higher
after oral than after i.v. doses
Significance?
What are the clinical implications?
Recommended
CrystalGraphics Presentations


