
SCE UltraNet - PowerPoint PPT Presentation
1 / 12
Title:
SCE UltraNet
Description:
Figure 2 Earthquake Sensors/Substations Located in the SCE's Service Area. Activated ... Application Development. Earthquake Simulation. Port. 5102. Figure 12 ... – PowerPoint PPT presentation
Number of Views:70
Avg rating:3.0/5.0
Title: SCE UltraNet
1
Data Streaming
Wave Front Plot
SCE Ultra-Net Satellite System
Affected Zone Prediction/Notification
Sensor Status Mapping
USAT/RTU Status Mapping
GIAS Database System
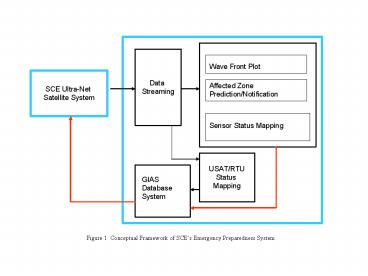
Figure 1 Conceptual Framework of SCEs Emergency
Preparedness System
2
Figure 2 Earthquake Sensors/Substations Located
in the SCEs Service Area
3
Satellite
Notification
Substation
Notification
Earthquake Data
Earthquake Data
Affected Substation
Activated
Sensor
QuakeView System
Figure 3 Information Flow in the Emergency
Preparedness System
4
Earthquake Simulation
Application Development
EQ ENGINE
EQ DATA PROCESSING
ARCVIEW ENVIRONMENT
ACTION HANDLING
RAW DATA FILES
TCP/IP
TCP/IP
Ground Acceleration
Wave Fronts
USAT / RTU
Sensor Activation
Filter Process
BASE MAP
Wave Front Logic
Figure 4 QuakeView System
5
Y
Quadrant I
The smallest Sweep angle from the origin to
one of the sensors In Quadrant I is determined
.
A line is drawn.
X
Southern-most Point
Figure 5 Southern-Most Point and the Sensor with
the Smallest Sweep Angle
6
Y
Quadrant I
The new origin
X
Figure 6 New Origin
7
Y
This is the Eastern-most point. Find the smalle
st
sweep angle from it in Quadrant II.
Quadrant II
X
Figure 7 Eastern-most Point and Search in
Quadrant II
8
The Northern-most point. Find the smallest re
sultant angle in
Quadrant III.
Y
X
Quadrant III
Figure 8 Northern-most Point and Search in
Quadrant III
9
The Western-most point. Find the smallest sweep
angle in Quadrant IV.
Y
X
Quadrant IV
Figure 9 Western-most Point and Search in
Quadrant IV
10
Southern-most point is reached.
A wave front can be plotted. Transmit these five
points to
ArcView Environment for plotting.
Figure 10 An Enclosed Wave Front
11
Application Development
Earthquake Simulation
Port 5102
Figure 11 TCP / IP Connections in QuakeView
System
12
Figure 12 Wave Fronts
Recommended
CrystalGraphics Presentations


