
Correlation and Regression Analysis - PowerPoint PPT Presentation
1 / 23
Title:
Correlation and Regression Analysis
Description:
Correlation and Regression Analysis. Many engineering design and analysis ... Station (610 ha) located upstream of a river feeding to Plover Cove Reservoir. ... – PowerPoint PPT presentation
Number of Views:796
Avg rating:3.0/5.0
Title: Correlation and Regression Analysis
1
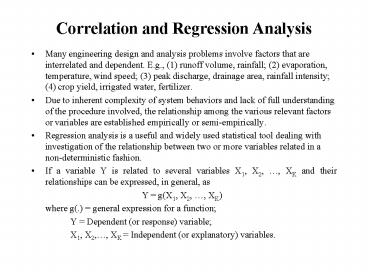
Correlation and Regression Analysis
- Many engineering design and analysis problems
involve factors that are interrelated and
dependent. E.g., (1) runoff volume, rainfall (2)
evaporation, temperature, wind speed (3) peak
discharge, drainage area, rainfall intensity (4)
crop yield, irrigated water, fertilizer. - Due to inherent complexity of system behaviors
and lack of full understanding of the procedure
involved, the relationship among the various
relevant factors or variables are established
empirically or semi-empirically. - Regression analysis is a useful and widely used
statistical tool dealing with investigation of
the relationship between two or more variables
related in a non-deterministic fashion. - If a variable Y is related to several variables
X1, X2, , XK and their relationships can be
expressed, in general, as - Y g(X1, X2, , XK)
- where g(.) general expression for a function
- Y Dependent (or response) variable
- X1, X2,, XK Independent (or explanatory)
variables.
2
Correlation
- When a problem involves two dependent random
variables, the degree of linear dependence
between the two can be measured by the
correlation coefficient r(X,Y), which is defined
as - where Cov(X,Y) is the covariance between random
variables X and Y defined as - where ltCov(X,Y)lt and ? ?(X,Y) ? .
- Various correlation coefficients are developed in
statistics for measuring the degree of
association between random variables. The one
defined above is called the Pearson product
moment correlation coefficient or correlation
coefficient. - If the two random variables X and Y are
independent, then ?(X,Y) Cov(X,Y) . However,
the reverse statement is not necessarily true.
3
Cases of Correlation
4
Calculation of Correlation Coefficient
- Given a set of n paired sample observations of
two random variables (xi, yi), the sample
correlation coefficient ( r) can be calculated as
5
Auto-correlation
- Consider following daily stream flows (in 1000
m3) in June 2001 at Chung Mei Upper Station (610
ha) located upstream of a river feeding to Plover
Cove Reservoir. Determine its 1-day
auto-correlation coefficient, i.e., r(Qt, Qt1). - 29 pairs (Qt, Qt1) (Q1, Q2), (Q2, Q3), ,
(Q29, Q30) - Relevant sample statistics n29
- The 1-day auto-correlation is 0.439
6
Chung Mei Upper Daily Flow
7
Regression Models
- due to the presence of uncertainties a
deterministic functional relationship generally
is not very appropriate or realistic. - The deterministic model form can be modified to
account for uncertainties in the model as - Y g(X1, X2, , XK) e
- where e model error term with E(e)0,
Var(e)s2. - In engineering applications, functional forms
commonly used for establishing empirical
relationships are - Additive Y b0 b1X1 b2X2 bKXK e
- Multiplicative e.
8
Least Square Method
- Suppose that there are n pairs of data, (xi,
yi), i1, 2,.. , n and a plot of these data
appears as - What is a plausible mathematical model describing
x y relation?
9
Least Square Method
- Considering an arbitrary straight line, y b0b1
x, is to be fitted through these data points. The
question is Which line is the most
representative?
10
Least Square Criterion
- What are the values of b0 and b1 such that the
resulting line best fits the data points? - But, wait !!! What goodness-of-fit criterion to
use to determine among all possible combinations
of b0 and b1 ? - The least squares (LS) criterion states that the
sum of the squares of errors (or residuals,
deviations) is minimum. Mathematically, the LS
criterion can be written as - Any other criteria that can be used?
11
Normal Equations for LS Criterion
- The necessary conditions for the minimum values
of D are - and
- Expanding the above equations
- Normal equations
12
LS Solution (2 Unknowns)
13
Fitting a Polynomial Eq. By LS Method
14
Fitting a Linear Function of Several Variables
15
Matrix Form of Multiple Regression by LS
or y X b e in short LS criterion is
The LS solutions are
16
Measure of Goodness-of-Fit
17
Example 1 (LS Method)
18
Example 1 (LS Method)
19
LS Example
20
LS Example (Matrix Approach)
21
LS Example (by Minitab w/ b0)
22
LS Example (by Minitab w/o b0)
23
LS Example (Output Plots)
Recommended
CrystalGraphics Presentations


