
Species - PowerPoint PPT Presentation
1 / 39
Title:
Species
Description:
Welcome back to IB 150... Nautilus eye. A 'pinhole camera' - no lens ... These times will likely alter with the attendance levels. Group tutoring will be held ... – PowerPoint PPT presentation
Number of Views:33
Avg rating:3.0/5.0
Title: Species
1
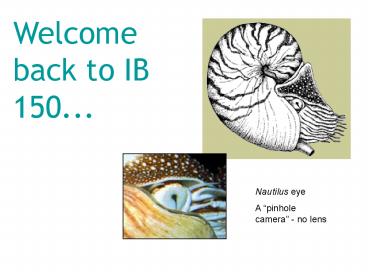
Welcome back to IB 150...
Nautilus eye A pinhole camera - no lens
2
Group Tutoring Sessions Now Available!
- Session will begin this week.
- They will take Tuesday and Thursday 630-730pm.
These times will likely alter with the attendance
levels. - Group tutoring will be held in 176 Burrill.
- Take advantage of these opportunities now before
the first test comes around. - If you wish more for more 1 on 1 help, contact
peer-tutoring_at_uiuc.edu for information on
individual tutoring.
3
Any changes or alterations in the exam grading
will be announced next week.
4
Fig. 24.20 Evolution is not a linear trend, but a
bush
5
Lecture 16 Macroevolution
Readings Ch. 24, rest of chapter (24.3)
Evolution of evolutionary novelties
incremental change inferred from
the range of complexity seen in living species
exaptation Evolution of genes that control
development Changes in rate and timing
heterochrony allometric growth,
padeomorphosis, Changes in spatial pattern
homeotic genes Hox genes Evolution is not goal
oriented linear trend vs. a bush species
selection
Exaptation - something that evolved for one
reason, but can also be used as a make-do
solution for something else. Example if bacteria
are forced to grow on novel substrates, mutations
of genes that do something else allow survival.
6
Lecture 17 Systematics
Readings Ch. 25 skip from Ultrametric trees
(p. 500) to end of Maximum parsimony and maximum
likelihood (p. 501)
Investigating the tree of life
phylogeny, systematics, molecular
phylogeny The evidence used in phylogenies the
fossil record, morphological and molecular data,
homology, analogy, convergent evolution,
parallelisms, reversals, homoplasy Phylogenetic
systematics and taxonomy
taxonomy (classification), binomial nomenclature,
hierarchical classification, Linnaeus, Linnaean
groups
Phylogeny construction
cladistics, clade, cladogram, monophyletic,
paraphyletic, polyphyletic, character state,
shared primitive state, shared derived state,
outgroup, ingroup, parsimony, Occams Razor,
phylogram Phylogeny and the genome
molecular clocks, neutral theory,
the universal tree of life
7
Fig. 25.2 - a phylogenetic tree and a surprise
8
Fig. 25.4 Examples of fossils. One kind of data
used to infer phylogenies. But we also use
morphological and molecular data to infer
phylogeny.
9
A problem that arises in inferring phylogenies
distinguishing homology from analogy. Homologous
- structures (characters) arise from a common
evolutionary ancestor Analogous - structures
(characters) are similar due to convergent
evolution - independent evolution See Fig. 25.5
for an example of convergent evolution of a
marsupial and a placental mole. The forelegs are
in the broad sense homologous structures, but the
specializations for digging are analogous - the
ancestors of the two species had more typical
running forelegs for millions of years.
Analogous structures are known as homoplasies.
10
A convergence is not the only kind of homoplasy.
There can be reversals and parallelisms as well.
These are most easily distinguished by looking at
one site in a gene in several different alleles
(or species)
convergence
parallelism
reversal
All produce confusion in trying to infer a tree
11
Fig. 25.6 DNA sequences need to be aligned before
we can deduce the homologous sites (a site is
just a position in the sequence).
12
Fig. 25.7 Sequences from species that have been
in existence for very long periods of time can be
similar just due to chance.
13
But lets go back and look again at the evolution
of alleles - where homoplasy is not such a huge
problem. We will then move toward inferring
phylogenetic trees for species, not just for
alleles within a species. Lets go back over how
we inferred a tree for alleles within a species.
14
Mutations contain a history of their past!
3 evolutionary steps
original
ATTAGATTAGCGATCGCTTTAATGGGGTAG
mutant 1
ATTAGATTAGCGATCGCATTAATGGGGTAG
mutant 2
T to A
ATTAGATTAGCGATCGCATTAATCGGGTAG
G to C
mutant 3
ATTAGATAAGCGATCGCATTAATCGGGTAG
T to A
15
Some more terminology
original
ATTAGATTAGCGATCGCTTTAATGGGGTAG
branch
mutant 1
root
ATTAGATTAGCGATCGCATTAATGGGGTAG
mutant 2
T to A
ATTAGATTAGCGATCGCATTAATCGGGTAG
G to C
mutant 3
ATTAGATAAGCGATCGCATTAATCGGGTAG
T to A
16
Note that we can infer the direction of
evolutionary change - for the first change, T is
the ancestral or primitive state, and A is the
derived trait.
original
ATTAGATTAGCGATCGCTTTAATGGGGTAG
mutant 1
ATTAGATTAGCGATCGCATTAATGGGGTAG
mutant 2
T to A
ATTAGATTAGCGATCGCATTAATCGGGTAG
G to C
mutant 3
ATTAGATAAGCGATCGCATTAATCGGGTAG
T to A
17
Most times, we do not observe every step of
mutational change, but we can often infer the
most distantly related sequence to the rest. We
can call this sequence the outgroup (could be
more than one sequence).
ATTAGATTAGCGATCGCTTTAATGGGGTAG
outgroup
ATTAGATTAGCGATCGCATTAATGGGGTAG
T to A
ATTAGATTAGCGATCGCATTAATCGGGTAG
G to C
ATTAGATAAGCGATCGCATTAATCGGGTAG
T to A
18
When you have identified the outgroup, you put
the root between the outgroup and the rest, which
becomes the ingroup.
ATTAGATTAGCGATCGCTTTAATGGGGTAG
outgroup
ATTAGATTAGCGATCGCATTAATGGGGTAG
T to A
ATTAGATTAGCGATCGCATTAATCGGGTAG
G to C
ATTAGATAAGCGATCGCATTAATCGGGTAG
T to A
19
This kind of tree graph, in which the lines do
not tell us anything about the amount of change
along each branch, is called a cladogram.
ATTAGATTAGCGATCGCTTTAATGGGGTAG
ATTAGATTAGCGATCGCATTAATGGGGTAG
T to A
ATTAGATTAGCGATCGCATTAATCGGGTAG
G to C
ATTAGATAAGCGATCGCATTAATCGGGTAG
T to A
20
An alternative way to draw an allele tree - a
phylogram, in which the branch lengths do tell us
about the amount of evolutionary change.
original
ATTAGATTAGCGATCGCTTTAATGGGGTAG
mutant 1
ATTAGATTAGCGATCGCATTAATGGGGTAG
mutant 2
ATTAGATTAGCGATCGCATTAATCGGGTAG
T to A
mutant 3
G to C
ATTAGATAAGCGATCGCATTAATCGGGTAG
T to A
21
A really remarkable phylogram Based on 987 bases
of the Hemagglutinin gene in influenza type A
strains from 1985 - 1996.
From Fitch et al.
The end of each line represents a particular
virus isolated in a particular year. About 250
viral types are represented.
22
Now lets start moving toward making trees for
species (and other taxonomic groups)
23
Present
19
9
16
11
24
8
3
15
20
1
17
12
2
7
14
10
21
4
18
13
6
22
11
23
TIME
The grand view of the combined effects of drift
and mutation - new alleles arise by mutation, may
go extinct immediately or increase. But all
alleles go extinct eventually.
24
Present
TIME
At this point, since we are leaving population
genetics behind, we will only need to know about
the allele tree - not the frequencies. (Note
this is not the same exact pattern as in the
previous slide).
25
Present
reproductive isolation
Species A
Species B
Species C
TIME
Now, what do you think would happen during a
speciation? The above is what is happening.
26
Present
Species A
Species B
Species C
TIME
In reality, we dont often have fossil DNA from
the past, so all we can do is sample DNA from
living species and infer trees for those.
27
Present
Species A
Species B
Species C
TIME
Furthermore, we often only sample the most common
allele in a species lower frequency alleles
(thin lines) are often omitted.
28
Terms again
Node (speciation event)
Species A
Species B
Species C
root
branch
TIME
29
A particular school of thought on inferring the
past that Campbell likes is called cladistics.
Cladistics espouses making cladograms by placing
species together that share derived characters or
features. How do we know what is derived? We
either observe the direction of change for the
particular character in the fossil record, or we
make a assumption about what is the outgroup, and
use that to infer direction. Primitive
original, derived later.
30
Fig. 25.10. How should we establish a set of
names (bird, orchid, snail) based on a
phylogenetic tree? Most modern systematists
want their groups to be monophyletic - single
origin.
Unfortunately, groups like reptiles are
paraphyletic.
31
Fig. 25.8. Modern systematists want their trees
and their Linnaean classification to agree. Carl
Linne was the inventor of the system of taxonomy
(classification) we still use. It is based on
nested hierarchies. Note that at the lowest
level we use italics, and that the genus name is
capitalized and the species name is not. This is
binomial nomenclature.
32
Fig. 25.9. An example of a tree and a taxonomy
that agree.
33
A problem We have talked about the existence of
homoplasy, and all about trees and what to use
them for, but how do we really deal with
homoplasy?
34
An answer We chose the tree on which there is
the smallest number of homoplasies - the smallest
number of convergences and their ilk. This is
also the tree with the smallest number of
evolutionary events, or steps as they are
called in the tree-inference business. This is an
application of the idea of parsimony or maximum
parsimony, which traces back to an English
philosopher named William of Occam. (Thus
Occams Razor)
35
Fig. 25.15 - an example of a partial parsimony
analysis. Note that the table in point 2 is
usually called a character-state matrix - each
character (site in the sequence) has one of four
states, A, C, G, or T.
36
Fig. 25.15 - summed over all of the 7 sites in
our gene sequence, the tree at the left is the
best or most parsimonious tree.
37
An important prediction of the neutral theory
(most mutations have neutral effects on fitness)
is that there should be a rough relationship
between the amount of molecular change and time.
This leads to the idea of a molecular clock.
Cytochrome C molecular clock (312 bases in coding
region)
38
Fig. 25.18. Modern molecular phyogenetics, using
among other statistical tools the molecular
clock, is attempting to infer the basic tree of
life. Two unique aspects are symbiotic fusions of
Bacteria with Eukarya, resulting in mitochondria
(3), chloroplasts (4), and possibly even the
eukaryotic cell (2), and horizontal transfers
of genes. The latter is yet another form of
homoplasy that clouds our view into the past.
39
Lecture 17 Systematics
Readings Ch. 25 skip from Ultrametric trees
(p. 500) to end of Maximum parsimony and maximum
likelihood (p. 501)
Investigating the tree of life
phylogeny, systematics, molecular
phylogeny The evidence used in phylogenies the
fossil record, morphological and molecular data,
homology, analogy, convergent evolution,
parallelisms, reversals, homoplasy Phylogenetic
systematics and taxonomy
taxonomy (classification), binomial nomenclature,
hierarchical classification, Linnaeus, Linnaean
groups
Phylogeny construction
cladistics, clade, cladogram, monophyletic,
paraphyletic, polyphyletic, character state,
shared primitive state, shared derived state,
outgroup, ingroup, parsimony, Occams Razor,
phylogram Phylogeny and the genome
molecular clocks, neutral theory,
the universal tree of life