
Phenotypic Correlation - PowerPoint PPT Presentation
1 / 24
Title:
Phenotypic Correlation
Description:
Phenotypic Correlation. degree to which two traits co-vary ... House mouse. rp = 0.22 -0.68. Bill length. wing length. Darwin's finch. rp = -0.18. rE. Trait 2 ... – PowerPoint PPT presentation
Number of Views:170
Avg rating:3.0/5.0
Title: Phenotypic Correlation
1
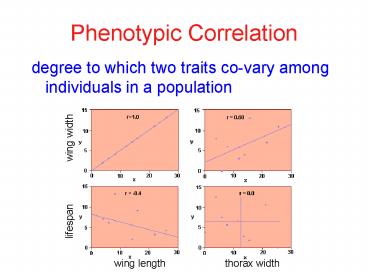
Phenotypic Correlation
- degree to which two traits co-vary among
individuals in a population
lifespan wing width
wing length thorax width
2
Genetic Correlation
- phenotypic correlation genetic environmental
correlation - rP rA rD rE
- rP hxhyrA
exeyrE
3
To measure genetic correlations
- Use same breeding designs as for additive
variance, but measure two traits instead of just
one - Correlations between traits in parents and
offspring - Correlation between traits in half-sibs and
full-sibs - OR
- Perform artificial selection
4
Why are traits genetically correlated?
- Pleiotropy single gene affects multiple traits
- in morning glories, floral pigment also affects
plant toxicity to herbivores - in fruit flies, a mutation in insulin receptor
doubles lifespan but causes sterility
5
- Pin and Thrum morphs in Primrose
- Homostylus flowers are rare but do occur.
- Linkage disequilibrium nonrandom association
between alleles at two loci - Selection for particular combination of alleles
at two loci generate a strong genetic
correlation. - Close linkage necessary
6
Genetic correlations in natural populations
7
Natural selection and evolution in correlated
traits
- Selection on one trait will lead to correlated
evolution in the other trait - Traits that are negatively correlated are said to
exhibit tradeoffs. - Offspring size and number
- Fecundity and lifespan
- Development rate and adult size
8
Selection experiment
9
Measuring selection
- On phenotypes (mostly morphology)
10
Visualizing selection on a morphological trait
11
Linear regression y a bxw a bz
Relative fitness
Phenotype (wing length)
12
Simple fitness functions
13
Linear and nonlinear terms y a bx cx2 w
a bz gz2
Relative fitness
Phenotype (wing length)
14
a bz gz2If g is negative,slope is
decreasing if g is positive, slope is
increasing.b measures linear selection. g
measures nonlinear (or quadratic) selection.
15
Real fitness functions
Wild radish
16
Selection with correlated traits
Which trait is the target of selection?
17
Multiple regression y a b1x1 b2x2 w
a b1trait1 b2trait2 b3trait3
partial regression coefficients
18
Total selection on a trait is sum of direct
selection indirect selection on correlated
traits
S1 b1 b2r12 b3r13
19
Experimental manipulation to measure selection
- Statistical measures cannot prove the existence
of direct selection on a trait. - Why?
- But statistical measures can indicate which
traits are probably not targets of direct
selection and which traits warrant further study. - To prove selection on a trait, experimental
manipulation is necessary. This is the only way
to eliminate possibility of correlation with
unmeasured traits.
20
Experimental approaches
- Directly manipulate the trait you think is under
direct selection - artificially lengthen and shorten the horns
of fungus beetles - Artificially manipulate color, pattern, display
sites (e.g., bowers),
21
Manipulation of morphology
(Andersson 1982)
22
Things to consider before doing such an experiment
- How much variation should you create (beyond the
range of variation in the current population)? - Does the manipulation itself affect performance
(can the birds fly with manipulated tails)? - What if you cant do a direct manipulation (finch
beak size)?
23
Plasticity in plant height as an adaptation to
density
- Impatiens capensis grows taller when grown at
high density. Is this an adaptation, or a
deleterious consequence of suboptimal conditions? - Grow plants to different heights in the
greenhouse by using different ratios of redfar
red light. - Transplant tall and short plants to the field in
both low and high density.
(Dudley and Schmidt 1982)
24
Plasticity in plant height as an adaptation to
density
- Selection for height was positive at high
density. bgt0 indicating selection on increased
height at high density - But b lt0 at low density, indicating selection to
decrease height at low density. - Interpretation tall plants better able to
compete for light under crowded conditions, but
there is a fitness cost to being tall when light
is not limiting
(Dudley and Schmidt 1982)