
Unit 1 Fossils - PowerPoint PPT Presentation
1 / 54
Title: Unit 1 Fossils
1
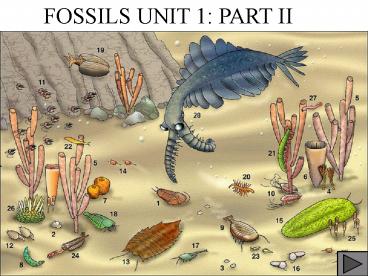
FOSSILS UNIT 1 PART II
2
- 1. Introduction
- See Unit 1 Fossils Part I file for
- Exercises 1. Fossils T/F and
- Exercise 2. Geological Time Line
- 3. Exercise 3 - Dating Fossils
- 4. Exercise 4 - Fossil Lineages
- 5. Suggested Readings Links
Home Page Unit 1 Fossils Part II
Back to Homepage
3
Fossils Introduction
- Fossils are the remains of organisms
- Dead, typically in excess of 10,000
- years
- Failed to decay
- Preserved in some form of bacteria-
- free environment
4
The Student will
3.6, 5.6, 5.9, 5.10, 8.4, 8.5, G.6
- Gain an understanding of what constitutes a
fossil and mechanisms of preservation - Become familiar with the concept of geological
time and what really big numbers of years mean - Learn about how dates are assigned to fossils
- Learn how fossils are utilized to examine the
historical relationships among organisms
5
Materials List
- Sheet of plastic 5X5
- Magnifying glass
- Tooth brush
- Sand
- Specimens
- insects in amber
- muskrat jaw
- fern leaf impression
- fossil sand dollar
- clam
- mineral gypsum
- fossil ghost shrimp burrow
- 2 coprolite specimens
- coyote leg bone
- petrified wood
- Iron concretion
- dinosaur tooth
- pottery sherd
- trilobite
- fossil tooth
- fossil vertebra
- coal
6
Material List cont
- Box 4 with three bags of shark teeth
- Bag 4.1 5 teeth (red dot)
- Bag 4.2 3 teeth (blue dot)
- Bag 4.3 2 teeth (no dot)
- Plastic container holding 32 white chips 32
red chips
7
Exercise 3. Dating Fossils
- Introduction
- Estimation of the age of
- fossils by their locations
- within strata or layers of
- sediment is called relative
- age.
- Fossils that are located
- in the lower strata are
- older than those that are
- near the top.
- Geologists and biologists use radiometric dating
to obtain an absolute time scale or age for
particular strata.
younger strata
older strata
8
- This latter method is based on the fact that
some minerals have radioactive isotopes that
change through time to other minerals through a
process called radioactive decay
- The amount of time it takes for half of a
parent (radioactive) isotope to turn into its
non-radioactive daughter isotope is called its
half-life.
9
(No Transcript)
10
Objective
- Your goal in Exercise 3 is to understand the
different ways geologists date fossils - You will
- Decide what radioactive material is best to date
a fossil depending on what strata it is located
in Exercise 3.1 - See the relationship that exists between the
loss of parent decay material and accumulation of
daughter product material - Exercise 3.2
11
Exercise 3.1. Which measure applies?
- Which of the radioactive decay measures in the
table would you use to date the following
fossils? Hint, use shorter half-life materials to
date more recent (younger) fossils. - 1) Stromatolites -1.5 BY
- 2) Wooly mammoth fur- 10,000- 14,000 Y
- 3) Tree fern leaves - 300 MY
- 4) Sea urchin - 36- 42 MY
- 5) date the age of stars from meteorites -15 BY
- The half-lives of several radioactive
- materials are shown in the table
For Answers
12
Answers to 3.1
- 1) Stromatolites -1.5 BY
- Uranium 235 useful range 10 million - 4.6 by
- 2) Wooly mammoth fur- 10,000- 14,000 Y
- Carbon 14 useful range 100 - 30,000 years
- 3) Tree fern leaves - 300 MY
- Uranium 235
- 4) Sea urchin - 36- 42 MY
- Uranium 235
- 5) date the age of stars from meteorites -15 BY
- Rubidium 87 useful range - billions of years
13
Exercise 3.2 Process of radioactive decay
To repeat, the half life (X) of a particular
radioactive isotope of an element is based on the
mean or average time it takes half of the parent
material to decay into the stable daughter
material.
The following experiment demonstrates how
radioactive decay occurs due to the chance change
of individual radioactive atoms into their
non-radioactive daughter atoms.
- Each student will make a table on a sheet of
paper or - one will be drawn on the board at the front of
the room. - The next slide shows what this table should look
like. - It will have 5 columns and 12 rows.
14
(No Transcript)
15
- In plastic container (box 3) there are 32 white
chips 32 red chips. - Assume that
- The container is a FOSSIL you want to determine
the age of. - The White chips (32) are atoms of a radioactive
material we will call the parent isotope. - The Red chips (32) are atoms of the non
radioactive (stable) daughter isotopes
The goal of this experiment is to determine the
half life of the white chips (radioactive
material).
- At the start, assume that your fossil has just
died. - (Only atoms of the parent radioactive isotope
(white chips) - are present.)
16
- The Teacher will
- Have someone sort the chips by color
- Distribute the white chips to students (all 32
white chips must be distributed) - Set aside the red chips
Directions
- Each student will
- Flip each white chip you have onto your desk.
- Exchange each white chip that has landed with
the colored center-side up with a red chip that
is brought to you. - Record on your table the total number of white
chips remaining in the class after the first coin
flip trial - under parent atom column for trial 1 row.
- Record the total number of red chips present in
the class under daughter atom column for the same
row.
17
- Repeat the process you have just completed for
trial 1 until - All of the white chips have been removed
- or
- 10 trials have been completed.
18
- You will be given a graph sheet to plot the
curve of the decay of the parent material on,
applying a dashed line between points (template
on next slide).
- To obtain the values you need for making the
decay curve, you will need to fill in the last
column of your table called decay of parent which
is the proportion of parent atoms (white chips)
that survived at each time interval, here
expressed as trials 0-10. - The proportion of white chips that have survived
each trial the number of white chips remaining
in column 2 under the trial row divided by the
total number of white chips at the start of the
experiment (32).
Thus, proportion of parent material surviving at
interval n white chipsn/32, where n the
interval number from 0 to 10.
Note that we have already filled in interval 0
for you on the table.
19
A. Graph of decay of parent material (
) accumulation of daughter material (
)(handout)
20
- Now fill in the last column for the accumulation
- of the red chips or daughter product.
- Because a red chip replaced a white chip that
- decayed, the proportion of red chips at each
- interval will be equal to
- 1- Proportion of surviving white chips
- Example
- At the death of the fossil (interval 0), the
proportion of - white chips surviving was 1.0 or all of them.
- The proportion of red chips accumulating was
1-1.0 0
- Plot the points for the accumulation of this
daughter - product on the same sheet of graph paper applying
- A solid line between points.
21
- Answer the following questions after you have
completed your experiment - What kind of curve does the decay of the parent
material resemble? (See curve figures on next
slide for comparison). Note the mathematical
formula that underlies the distribution of chip
numbers decaying through time.
- What kind of curve does the accumulation of the
daughter product resemble? (See curve figures on
the next slide for comparison). Note the
mathematical formula that underlies this
distribution of accumulating chips over time.
22
Examples of lines describing various mathematical
distributions.
23
Stop!!! Answers on next page!
24
Radioactive Dating As radioactive materials
decay, their decay products accumulate.
Decay of parent isotope Inverse exponential y
e -x
Production of decay product Logarithm y ln (x)
Time in half-lives
Time in half-lives
25
- What is the half-life for the white chips in
this experiment? Hint, you can determine this by
examining your fraction column How many
intervals did it take to get to approximately 0.5
or 1/2 of the white chips surviving)?
Challenge questions Based on the results of your
experiment on the rate of decay of white chips
- If you found a box with only 12 white chips in
it and 24 colored chips, how old' would you
estimate this fossil box to be in trial number
time?
- If you found a box with only 4 white chips in it
and 28 colored chips, how old would you
estimate the box to be in trial number time?
26
- If you found a fossil (box) with 38 white chips
and only 4 red chips, how old would you
estimate the fossil box to be in trial number
time?
- What is your conclusion about what determines
the fossil age estimate you obtained from your
answers to questions 4 - 6?
27
Exercise 4. Fossil Lineages
- Introduction
- Evolution is a process that takes place from one
generation to the next in living family trees or
lineages of plants, animals and other organisms.
A lineage or clade is a sequence of ancestors
(parents) and descendents (offspring).
- Delineating fossil lineages is important to our
understanding of how evolutionary change in
organisms is associated with environmental
change, chance events, and gradual modification
to better adapt organisms to their roles in the
ecosystem they occupy.
28
- The information we can obtain on adaptation from
the study of fossils is limited to morphological
traits and often only those aspects of morphology
that are associated with the skeleton as in teeth
and bones or shells
- However, fossils are valuable to the biologist
because they can provide an ordered record of the
timing of appearance and/or loss of traits as
organisms are replaced by descendents over
millions of years of geologic time.
- In this exercise, you will learn how decisions
are made about the historical relationships among
organisms through examination of fossil tooth
morphology in sharks.
29
- The best way to examine historical relationships
among organisms is to examine changes in traits
in lineages through time. - 1. Organisms that are more closely related share
more traits in common. - 2. And Individuals share more characteristics in
common and thus are more closely related to one
another the further one goes down in the
classification hierarchy from the most inclusive
category (Kingdom) to the least inclusive
(Species). - KINGDOM -share fewest characteristics PHYLUM
- CLASS
- ORDER,
- FAMILY
- GENUS
- SPECIES- share most characteristics
30
Objective
- Your goal in Exercise 4 is to understand the
relationship between fossil lineages. - For Science standards
- You will determine a lineage of shark teeth
- Exercise 4.1
- by species differences and similarities.
- by examining the position of species in a cross
section of the layers of sediments that have been
laid down over time - You will compare two lineages of shark teeth
using an outgroup comparison Exercise 4.2
31
Exercise 4. Fossil Lineages
32
Exercise 4.1 Determining a lineage.
- Your teacher will display the five teeth in box
4 4.1 in alphabetical order on the table at the
front of the room. (Each tooth has a red dot on
the enamel at the base of blade/crown for
locating purposes.)
- Carcharocles auriculatus,
- Carcharocles chubutensis,
- Carcharocles megalodon,
- Cretolamna appendiculata,
- Otodus obliquus.
33
Directions
- These teeth are from the shark family
Otodontidae, mackerel sharks, and includes the
Giant White Shark (Megalodon) that was long
thought to be the ancestor of the Great White
Shark of today. The lineage is called the
Megalodon Shark Lineage.
34
- Your job is to examine the 5 teeth pictures of
them on the next slides with the goal of placing
them in an hypothesized lineage that represents a
trend in tooth structure.
- Make a table like the one above to show your
decision process.
35
2. Examine the major parts of a shark tooth
handout
36
- Each of the five teeth will be stationed
- with its name labeled at the front of the room
- 3. Line up and visit each station examining
- the tooth there. Take notes as to the trait
- values it possesses.
- (e.g. What is the size of the tooth, how wide
- is the blade relative to its height, how thick is
the - blade, is the blade edge smooth or with teeth
- (serrated) and so on.
- Note teeth take on the color of the sediment
they are buried in. - Thus color is not a good trait to base
relationships on.
37
- 4. Using your notes and the figures of the teeth
below, place the five species in order of oldest
to youngest in 1st Try column and state reason
for order you chose in next column.
Cretolamna
C. chubutensis
C. auriculatus
Otodus
Giant White C. megalodon
38
- This picture is of a sediment wall showing layers
that often contain fossils oldest layers are at
the bottom most recent (youngest) at the top - 5. Fill in the 2nd TRY column with your new
ordering of shark species.
39
- 6. Using your notes, the new ordering of teeth
after seeing their placement in a stratigraphy,
and the figures of the teeth below, list what
traits change in this lineage in the next column.
Cretolamna
C. chubutensis
C. auriculatus
Otodus
Giant White C. megalodon
STOP! Answers on next pages
40
Answers for Megalodon lineage
- From youngest to oldest species
- Highest strata
- Youngest/most recent Carcahrocles megalodon
Carcharocles chubutensis - Otodus obliquus
- Oldest/most ancient Cretolamna appendiculata
- Lowest strata
- Reason the above lineage is correct is the
relative position of teeth of the species in the
layers of sediment deposited over time.
Trait change in this lineage is discussed on next
slide
41
The general trend in the Giant White shark
lineage, (Family Otontidae)from oldest to
youngest species is 1. increase in tooth size
2. Increase in thickness 3. loss of the
secondary cusps due to the increase in thickness
4. acquisition of a serrated cutting edge on
the tooth blade (crown).
Cretolamna
Giant white C. megalodon
42
- 7. Examine this figure to which radiometric dates
have been added to the stratigraphy. (Dates based
on rates of decay of radioactive isotopes). - 8. In the last column of your table, list the
approximate age of each tooth in millions of
years ago (mya).
43
Exercise 4.2 Comparing lineages.
- The shark family Otodontidae culminating with the
Giant White Shark, Carcharocles megalodon, is
closely related to the family, Lamnidae, which
culminates with the extant or still living Great
White Shark Carcharodon carcharis (Bag 4.2 (blue
dots).
- Examine the figures below of Great White shark
lineage
I hastilis
I. praecursor
Great White Carcharadon
44
Directions
- 2. Examine the relationship between the two
families in the cladogram below. - A cladogram depicts the evolutionary relationship
between lineages. The two families are sister
lineages, which have the same immediate common
ancestor, Cretolamna appendiculatus.
common ancestor
45
- The tooth belonging to the Mackerel species,
Cretolamna appendiculatus is placed on the table
in front of the class at the bottom of a V. This
is the common ancestor to the - Giant White and Great White shark lineages
- Positioned on the left side of the v above
Cretolamna are the four other Megalodon lineage
teeth from bag 4.1 in order of their appearance
in the fossil record. Otodus, C. auriculatus, C.
chubutensis and C. megalodon.
- On the right side of the V the three fossil Great
White lineage teeth are positioned in order of
their - appearance in the fossil record
- 1. Isurus praecursor 36-37 mya
- 2. Isurus hastilis 3-5 mya
- 3. Carcharodon carcharis Great White Shark 2 mya
- present
46
- Before proceeding,
- Review your diagram of shark tooth structure
given to - you for Ex 4.1
- 3. Each group of 4 or 5 students will take turns
examining the teeth positioned in the V. Do not
touch the teeth, but look for similarities and
differences between the two lineages - the Giant White shark lineage on the left
- the Great White shark lineage on the right side
of the V - 2 minute observation time
47
- A Comparison with an outgroup (species that does
- not share a recent common ancestor) helps when
you - are trying to identify the similarities and
differences - between two families.
We have provided fossil teeth of two outgroup
species
Tiger Shark
Crow Shark
48
4. Examine the relationship in this cladogram
between the two less closely related shark
groups, Crow sharks (65 mya) Tiger Sharks (5
mya-present) to the Giant White and Great White
shark lineages
49
- The close similarity between the mackerel and
white sharks should be apparent when one examines
how different the tiger and crow teeth are from
that of the Lamniformes (whites and mackerels).
- 5. Each group will take turns observing the teeth
again. - with the out group species now positioned
relative to the V (crow sharks closer to the
lineage tiger sharks more - Distant)
- 2 minute observation
time/group
- 6. Look closely at the two end species, Giant
White on the left side and Great White on the
right side. Originally, the Giant White Shark was
considered a descendent of the Great White
because both have a serrated (saw-like) blade
edge. Examination of other species in the two
lineages falsified this hypothesis. - 7. Why can the presence of serrated tooth edges
not be evidence for same lineage status?
Stop! Answers on next slides
50
Answers Exercise 4.2
- General trends in the Megalodon lineage (Family
Otontidae) are - an initial increase in tooth size and thickness
- the loss of the secondary cusps due to the
increase in thickness. - The acquisition of a serrated cutting edge on the
tooth blade (crown).
51
Family Otodontidae continued
- Neck zone or collum is present
- This provides an additional area of attachment to
the jaw and prevents tooth loss when biting on
something - V or U shaped-roots add greater attachment
strength also - Convex face of blade (resembles D in
cross-section) - provides greater stability to the blade which is
less - likely to break
- Serrated blade edge
- Serration are even and small
52
Laminidae Great White Shark
- No collum
- Roots of the tooth do not have well-branched root
lobes - V or Ushaped roots are not observed.
- Serrated edge
- variable in size but generally larger than in
Giant - White Shark
These significant differences caused the
paleoichthyologist Henri Cappetta (1987) to place
the Megalodon or Giant White Shark and the Great
White Shark not only in separate genera but in
separate families.
53
Suggested Reading
- Dinosaurs Walked Here, and Other Stories Fossils
Tell - By Patricia Lauber
- Dinosaur Tracks and Other Fossil Footprints of
the Western United States By Martin G. Lockley - Fossil Legends of the First Americans By Adrienne
Mayor
54
Links
Exercise 3
- This exercise is after that developed by John
Delaughter at the following website
http//www.earth.northwestern.edu/people/seth/202/
DECAY/decay.pennies.slow.html - John DeLaughter Simulation of radioactive decay.
- http//www.lon-capa.org/mmp/applist/decay/decay.h
tm - W. Bauer 1999
- http//www.mines.utah.edu/ggapps/radiation/radiat
ion.html - http//www.colorado.edu/physics/2000/isotopes/radi
oactive_decay3.html
Exercise 4
http//www.elasmo-research.org/education/evolution
/golden_age.htm http//en.wikipedia.org/wiki/Shark
http//www.fossilguy.com/topics/megshark/megshark
.htm Lutz Andres http//www.nmnh.si.edu/paleo/sh
arkteeth/index.html
Recommended
CrystalGraphics Presentations


