
Proposed Conservation Strategies for Diospyros celebica - PowerPoint PPT Presentation
1 / 47
Title:
Proposed Conservation Strategies for Diospyros celebica
Description:
... Conservation Strategies for Diospyros celebica. Prasit. Amy. Aileen. Zue. Rao ... (microsatellite) marker was developed by (Weber & May 1989 in human and found ... – PowerPoint PPT presentation
Number of Views:203
Avg rating:3.0/5.0
Title: Proposed Conservation Strategies for Diospyros celebica
1
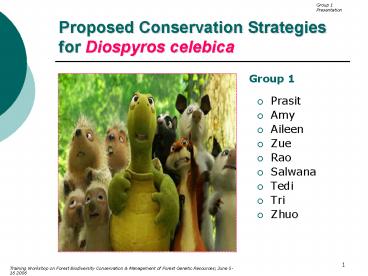
Proposed Conservation Strategies for Diospyros
celebica
Group 1
- Prasit
- Amy
- Aileen
- Zue
- Rao
- Salwana
- Tedi
- Tri
- Zhuo
2
Presentation Outline
- Background/Rationale
- What are the critical biological information (BI)
needed? - How can we generate the BI?
- How can we translate these BI to environmental
conservation strategies?
3
D. celebica
4
Taxonomy
- Kingdom PlantaeDivision MagnoliophytaClass Ma
gnoliopsidaOrder EricalesFamily EbenaceaeGenu
s Diospyros - Species Celebica
5
Population Status and Trends
Status of origin Endemic to Sulawesi (Minahasa
and Bolaang Mongondow/North Sulawesi Parigi,
Poso, Donggala, Toli-toli, Kolonodale and
Luwuk/Central Sulawesi
Maros, Barru, Luwu and Mamuju/South
Sulawesi) Floristic element Eastern provinces
of Malesian element Major ecological region
Sulawesi
- Once a widespread species in Sulawesi, it is now
comparatively rare, especially in the South - Exported since 18th century
- When in forests, D. celebica tends to scatter
irregularly
6
Rationale
- Rare plant conservation programs must be guided
by the species biological attributes. - Ecological and genetic processes often interact
synergistically to influence the population
viability and to determine the persistence of
populations in the long run. - Conservation has a cost and the resources
available for conservation programs are always
limited. Thus, CS must not only be scientifically
justified but also practical in terms of resource
availability.
7
What Are The Critical BI?
ECOLOGY
GENETICS
- Distribution habitat
- Demography
- Germination
- Phenology
- Level of genetic diversity
- Spatial genetic structure
- Population differential
- Mating system
- Minimum population size
8
Ecological Distribution Habitat
- Ecological interaction between plants and their
environment can influence population growth rates
via their effects on fecundity, growth, or
survivorship of individuals (Blundell and Peart,
2001 Peters, 2003) - The studies on population dynamics and
demography patterns will lead to a better
understanding of the natural processes that
operate within the population
9
Distribution and Habitat
10
Legend Natural distribution of D. celebica in
Indonesia (Overall natural distribution)
11
Conservation status measures
- IUCN status available of the Vulnerable (VU)
(International Union for Conservation Red Data
Book, 1978) - In Sulawesi, D. celebica is protected and there
is a quota system in place. The Indonesian
government has already started a planting
program. It has not, however, been planted on a
large commercial scale
12
Threats Utilization
- D. celebica is threatened by heavy exploitation
since it is an important source of streaked ebony
13
D. celebica timber is used for piano keys,
carvings, brush backs, inlaying, and parts of
stringed instruments.
14
Germination Study
Population Survey
1
5
Ecological Approach In Conserving Ebony
2
Phenology
Spatial Distribution
4
3
Population Dynamics Demographic Studies
15
1. Population Survey
Study Plot
200m
- Tagging
- Diameter measurement (DBHgt 5cm)
- Mapping coordinate using GPS GIS
200 m
?
To know the population status and relative
density of ebony in the area.
16
(No Transcript)
17
Demography
Field survey
Set-up plot
Long-term short-term survey
- Involves population dynamics, species recruitment
and mortality
18
2. Spatial Distribution
Soil
Information
Climate
Topography
?
To get information on habitat preference of ebony
(ridge, valley, slope) from established plot
19
(No Transcript)
20
Mt. Makiling Forest Reserve
- 65 km SE Manila
- shifting cultivation, burned and selectively
logged - Mature secondary forest with natural mixed stand
- Dominated by Celtis luzonica and Diplodiscus
paniculatus - Tropical monsoon
21
(No Transcript)
22
Structural characteristics of main canopy species
- 113 tree species and 6 palms, gt5 cm dbh
- Highest density - Celtis
- Highest basal area -Diplodiscus
- Max. dbh by Ficus (balete, strangling fig)
- Max. mean height of 21m
23
3. Popn Dynamics Demographic Studies
Regeneration Quadrat Plot
- WHY???
- Monitor growth
- Seedling recruitment and mortality of the
seedling (3 years short-term study
10m
3 . First year seedlings will be identified,
marked appearance will be recorded
10 m
?
to know the changes taking place in the life
cycle of ebony
24
4. Phenology of Ebony
- STEPS
- Identify the ebony tree from the established
plots/ - Check and measure every month
- Do some ranking such as budding stage, peak
bloom and mature seed of ebony.
?
- Reproductive biology will determine gene flow
(mating system, pollination, fruit dispersal,
etc.) recruitment rate of the species (Lee,
2006 personal commn)
25
Pollination Biology
Observation
Pollinators
Study on Pollination Biology
Conservation strategy
Wind
Conserve animals that are seed dispersal agents
Dispersal strategy
Observation
Animals
26
Regeneration species role
- Flowering and fruiting occurs at the age of
5-7 years - Seeds remain viable for only a short time
- Seeds vectors
- Bats
- Birds
- Monkeys
- Found with Homalium celebicum
27
Germination study
From established plot, set up seed trap for
seedfall study of ebony
Monthly seedfall collection will be done seeds
will be checked
Correlation of seed weight to germination
capacity of ebony
For mature sound seeds, weighing germination
test will be done to compare growth survival
from natural forest condition
?
To know the germination trait of ebony for
ex-situ conservation.
28
In summary
29
Rationale for Genetic Info
- Allelic richness could contribute to population
growth thru its effect on evolutionary potential,
or the ability of a species to respond to changes
in its selective environment. - Reduced heterozygosity can result in decrease of
population growth due to inbreeding depression. - Therefore, we need to know the genetic diversity
partition within and among populations
30
Levels of Genetic Diversity
Minimum Population Size
1
5
Genetics Approach Conserving Ebony
2
4
Spatial Genetic Structure
Mating System
3
Population Differentiation
31
1. Levels of Genetic Diversity
?
- To estimate level of genetic diversity that we
need to - generate information
aThe scoring scheme follows closely those in
Hillis et al.2 and Karp and Edwards49.
32
Why Choose SSR Marker ?
- SSR- (microsatellite) marker was developed by
(Weber May 1989 in human and found to be
abundant in plant by Morgante Olivieri 1993) - Very high degree of polymorphism codominance
make them extremely informative - Practical number of loci is 10
- Few as 5 or 6 microsatellite loci can often
answer many conservation genetic questions (e.g.
paternity, pollen flow) that cannot be answered
with 30 or more isozyme loci - High reliability (reproducibility)
- If the resources is limited, we can use allozyme
33
How to Get The Parameters ?
- D.celebica leaf samples will collected from 40
populations base on 40 area divide based on soil,
climate and slope - From each population, about 30 adults will be
sampled
Sample Collection
DNA extraction
Microsatellite analysis
Analysis data
34
Result of Genetic Diversity
- Low genetic diversity means ? not enough
sufficient gene pool for short term adaptation
and long term evolutionary
Need to enhance by the introduction of new
alleles through introgression following
hybridization for long term conservation
35
2. Spatial Genetic Structure
?
To determine genetic structure within a
population
Moran I Coefficient analysis statistical analysis
- Significantly structured
- Need sampling strategy for ex-situ conservation
- random
- Need capture all
- Choose and select
36
3. Population genetic structure
Erikson Ekberg 2001
37
Analysis Data from SSR Analysis
To determine coefficient of population
differentiation.
Gstlt0.050 low genetic differentiation
0.050ltGstlt0.15 moderate genetic differentiation
0.151ltGstlt0.250 large gene differentiation
0.250ltGst very large gene differentiation
38
if high population differentiation
- Mean
- --low gene flow
- --high inbreeding
- --low genetic diversity
- --high variation among population
- ?more populations need to be conservation
39
If low population differentiation
- Mean
- --high genetic flow
- --high genetic diversity
- --low variation among population
- --Low population genetic differentiation among
population implies no preference in
identification of population for in-situ
conservation or germplasma collection for ex
situ conservation - ?need more bigger area, and few population
40
4. Mating System and Gene Flow
General description (Gregorius 1989) Random
mating, the environmental influence on mating
events, selfing and the consequences of selfing
and other forms of inbreeding, and
incompatibility systems
Data analysis by using multilocus mating system
program (MLTR) Ritland (1996)
- OUTCROSSING RATE
41
Mating System
- Example
- Predominantly outcrossing
- Selfing
- Ex-situ conservation (field genebank)
- Outcrossing collect many seeds from a few
mother trees - Selfing collect seeds from many mother
trees)
42
5. Minimum Population Size
- How many individuals in a conserved population
are needed to maintain evolutionary potential of
population and to resist to inbreeding depression
from generation to next generation
?
43
NNumber of individuals in population t Number
of generation HtHeterozygosity at time t
Most breeders agree that A small loss of
heterozygosity by 1 from one generation to next
generation will not be significant for breeding ,
and does not result in inbreeding depression. In
other word, we accept Ht199Ht and then
calculate N50. So 50 individuals is often
referred to as the basic rule of conservation
genetics under the conditions of absence of
selection, randomness of mating, each individuals
in reproductive phase.
Theoretically
H selection
Ht
Ht1
H mutation
44
Minimum Population Size
- In fact, a population is in selection
and non-randomness of mating, which are very
difficult to be quantified, so a population size
of 500 reproducible individuals is hoped to
represent a safety device and to provide a better
chance for the restoration of genetic variation
by mutation against the loss (Hattemer 2005). - If a population has less than 500
individuals, maybe all of them should be
conserved.
45
CONCLUSION
ECOLOGY
GENETICS
- Distribution habitat
- Demography
- Germination
- Phenology
- Level of genetic diversity
- Spatial genetic structure
- Population differential
- Mating system
- Minimum population size
46
THANK YOU
K L
Dr. Kelvin and Dr. Lee
47
Demography
Recommended
CrystalGraphics Presentations


![Eleanor McGregor [Director: Conservation] PowerPoint PPT Presentation](https://s3.amazonaws.com/images.powershow.com/8026054.th0.jpg?_=20160801045)


