
CDMP Storm Hazard Atlas: Jamaica - PowerPoint PPT Presentation
1 / 13
Title:
CDMP Storm Hazard Atlas: Jamaica
Description:
Jamaica. Montego. Bay. Kingston. Portland. Bight ... Jamaica. Probable. Storm Effects. 2. Kingston: Capital city. and major port. ... – PowerPoint PPT presentation
Number of Views:181
Avg rating:3.0/5.0
Title: CDMP Storm Hazard Atlas: Jamaica
1
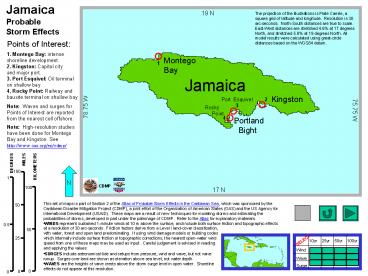
Jamaica Probable Storm Effects
The projection of the illustrations is Plate
Carrée, a square grid of latitude and longitude.
Resolution is 30 arc-seconds. North-South
distances are true to scale. East-West distances
are stretched 4.6 at 17 degrees North, and
stretched 5.8 at 19 degrees North. All model
results were calculated using great-circle
distances based on the WGS84 datum.
Points of Interest
1. Montego Bay intense shoreline development.
Montego Bay
1
2. Kingston Capital city and major port.
Jamaica
3. Port Esquivel Oil terminal on shallow bay
4. Rocky Point Railway and bauxite terminal on
shallow bay
Kingston
2
Port Esquivel
3
Note Waves and surges for Points of Interest
are reported from the nearest cell offshore.
Rocky Point
4
Portland Bight
Note High-resolution studies have been done for
Montego Bay and Kingston. See http//www.oas.org/e
n/cdmp/
N
- This set of maps is part of Section 2 of the
Atlas of Probable Storm Effects in the Caribbean
Sea, which was sponsored by the Caribbean
Disaster Mitigation Project (CDMP), a joint
effort of the Organization of American States
(OAS) and the US Agency for International
Development (USAID). These maps are a result of
new techniques for modeling storms and
estimating the probabilities of storms, developed
in part under the patronage of CDMP. Refer to
the Atlas for explanatory materials. - WINDS represent sustained 1-minute winds at 10 m
above the surface, and include both surface
friction and topographic effects at a resolution
of 30 arc-seconds. Friction factors derive from
a Level I land-cover classification, - with water, forest and open land predominating.
If using wind damage models or building codes - which internally include surface friction or
topographic corrections, the nearest open-water
wind - speed from one of these maps may be used as
input. Careful judgement is advised in reading - and applying the values
- SURGES include astronomical tide and setups from
pressure, wind and wave, but not wave runup.
Surges over land are shown as elevation above sea
level, not water depth. - WAVES are the heights of wave crests above the
storm surge level in open water. Shoreline
effects do not appear at this resolution.
2
Winds
10-Year Return Time
Jamaica
1
1. Montego Bay 31 m/s
2. Kingston 29 m/s
2
3. Port Esquivel 29 m/s
3
4
4. Rocky Point 28 m/s
N
3
Waves
10-Year Return Time
Jamaica
1
1. Montego Bay 3.8 m
2. Kingston 3.6 m
2
3. Port Esquivel 3.6 m
3
4
4. Rocky Point 3.6 m
Input data lacks sufficient detail.
N
4
Surges
10-Year Return Time
Jamaica
1
1. Montego Bay 0.4 m
2. Kingston 0.7 m
2
3. Port Esquivel 1.6 m
3
4
4. Rocky Point 1.1 m
N
5
Winds
25-Year Return Time
Jamaica
1
1. Montego Bay 41 m/s
2. Kingston 39 m/s
2
3. Port Esquivel 39 m/s
3
4
4. Rocky Point 38 m/s
N
6
Waves
25-Year Return Time
Jamaica
1
1. Montego Bay 5.1 m
2. Kingston 4.7 m
2
3. Port Esquivel 4.9 m
3
4
4. Rocky Point 4.8 m
Possibly invalidinput data lacks detail.
N
7
Surges
25-Year Return Time
Jamaica
1
1. Montego Bay 0.7 m
2. Kingston 1.4 m
2
3. Port Esquivel 2.8 m
3
4
4. Rocky Point 1.9 m
N
8
Winds
50-Year Return Time
Jamaica
1
1. Montego Bay 49 m/s
2. Kingston 46 m/s
2
3. Port Esquivel 46 m/s
3
4
4. Rocky Point 45 m/s
N
9
Waves
50-Year Return Time
Jamaica
1
1. Montego Bay 6.1 m
2. Kingston 5.1 m
2
3. Port Esquivel 5.8 m
3
4
4. Rocky Point 5.7 m
Possibly invalidinput data lacks detail.
N
10
Surges
50-Year Return Time
Jamaica
1
1. Montego Bay 1.0 m
2. Kingston 1.8 m
2
3. Port Esquivel 3.9 m nearby, up to 4.2 m
onshore to the northeast
3
4
4. Rocky Point 2.5 m
N
11
Winds
100-Year Return Time
Jamaica
1
1. Montego Bay 55 m/s
2. Kingston 53 m/s
2
3. Port Esquivel 53 m/s
3
4
4. Rocky Point 52 m/s
N
12
Waves
100-Year Return Time
Jamaica
1
1. Montego Bay 6.9 m
2. Kingston 5.7 m
2
3. Port Esquivel 6.6 m
3
4
4. Rocky Point 6.6 m
Possibly invalidinput data lacks detail.
N
13
Surges
100-Year Return Time
Jamaica
1
1. Montego Bay 1.4 m
2. Kingston 2.4 m
2
3. Port Esquivel 5.0 m nearby, up to 6.1 m
onshore to the northeast.
3
4
4. Rocky Point 3.3 m
N
Recommended
CrystalGraphics Presentations


