
SPSS WORKSHOP - PowerPoint PPT Presentation
1 / 70
Title:
SPSS WORKSHOP
Description:
Roger Berger. Mathematical Sciences & Applied Computing Department. Gaurav Jaju. Melissa Wilson. Statistics Laboratory. http://www.west.asu.edu/StatLab ... – PowerPoint PPT presentation
Number of Views:445
Avg rating:3.0/5.0
Title: SPSS WORKSHOP
1
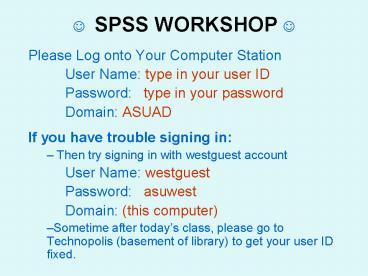
? SPSS WORKSHOP ?
- Please Log onto Your Computer Station
- User Name type in your user ID
- Password type in your password
- Domain ASUAD
- If you have trouble signing in
- Then try signing in with westguest account
- User Name westguest
- Password asuwest
- Domain (this computer)
- Sometime after todays class, please go to
Technopolis (basement of library) to get your
user ID fixed.
2
Laptops
- You can move the laptop to where ever you want to
sit. - If the laptop gives you a warning that the
battery is running low, we have extra laptops you
can switch with. - If the laptops are not frequently used then they
will go to sleep. So please move your mouse
every few minutes. - If the laptops happen to fall asleep (or shut
down), - please push the power button, which is located at
top left hand corner of your keyboard. - Then you will have to retype in the password.
- There is a sign in sheet going around the room
for the laptops. Each lap top has a unique
identification number located behind the screen.
Please put your name next to the laptop you are
using
3
Workshop IIData Analyses with SPSS
- Roger Berger
- Mathematical Sciences
- Applied Computing Department
- Gaurav Jaju
- Melissa Wilson
- Statistics Laboratory
http//www.west.asu.edu/StatLab
4
Workshop II Overview (p. 1)
- Function of Stat Lab
- Review of basic function of SPSS Data Editor
- Complete survey and enter data
- Brief review of how variables were edited in
variable view - Transforming variables in SPSS
- Create composite scores
- Reverse scoring
- Syntax
- Keeping track of data manipulation and analyses
- Syntax window
- Repeat of descriptive statistics
- Level of measurement
- Summarizing distributions of variables
- Central tendency and variability (dispersion)
- Relational and inferential statistics
- Relationships cross tabulations and
relationships - Inferential statistics (t-tests)
- Stat Lab resources
- Online resources survey design
5
Open up your internet Explorer
- http//www.west.asu.edu/StatLab
- Click on Workshops
- Click on Data used for SPSS Workshops
- Click on Fin_Health_SWG693
- Please save it in your Desktop.
- Close the internet browser.
6
SPSS Accessibility (p. 3)
- Network access
- Technopolis (basement of library)
- Desktop (hard drive) installed
- Computer Classrooms
- Stat Lab
- Software versions can be purchased at the
Computer Store (or Bookstore) - Student Edition (SE) (has limitations). 95.00
- Grad Pak (has much more features)
- (version 14 15)
- 209.00
- only graduate students can get it
- Can download price list from http//bookstore.asu
.edu/
7
Accessing the Statistic Laboratory
- Location CLCC 107
- Phone (602) 543-6117
- Website http//www.west.asu.edu/StatLab
- Operating hours See website
- When using the lab, please sign in at the front
counter
8
Support for Statistics (p. 4)
- Function of Stat Lab (also pp. 5-7)
- The Stat Lab staff assists students with aspects
of statistical software. - The Stat Lab is not set up to provide one-on-one
tutorial service for students on a regular basis. - However, we have and frequently do answer general
statistic questions. - Statistics Tutoring
- Learning Enhancement Center
- TRiO (SSS) program
9
Overview of the Research Process
Page 8
DISCUSSION SECTION
Interpretation Were the hypotheses supported?
Why or why not? Any limitations? What are
the Implications? Suggestions for further
research?
RESULTS SECTION
Data Analysis Descriptive Statistics Inferential
Statistics
METHODS SECTION
Measures or Instruments Validity - What did we
measure? Reliability How precise was the
measure? Data Analytic Approach Which
type of data analyses were conducted?
METHODS SECTION
Participant Characteristics Who did you
sample? Procedures How did we do the
observations?
AT THE END OF LITERATURE REVIEW OR INTRODUCTION
Based on theory literature review, what is
(are) the question(s) you want to address? Do
males and females have different attitudes? Do
participants in different age groups have
different attitudes? Will a research methods
course (intervention) increase students attitudes
to research?
Research Consulting Center Statistics Lab CLCC
107 www.west.asu.edu/rcc (602) 543-6117
10
Please fill out the survey (Remove the last page
of your handout)
- Response
- Strongly Disagree
- Disagree
- Agree
- Strongly Agree
- Sex
- Male
- Female
- Age
- Response
- Strongly Disagree 1
- Disagree 2
- Agree 3
- Strongly Agree 4
- Sex
- Male 1
- Female 2
- Age
- Actual age in years
- Having ID column will help you keep track of
cases - What do the 1st five questions measure?
- What do the 2nd five questions measure?
11
Please launch SPSSthen Turn to Page 10 of Handout
- Menu Bar
- Data Transform are used to manipulate the data
in data editor (i.e., spread sheet) - Analyze and Graphs are used to create output
- Tabs (bottom left hand corner of data editor)
- Data View (top panel)
- Columns Variables (e.g., questions on survey)
- Rows Cases (e.g., survey)
- Variable View (bottom panel)
- How we edit the variables
- Give variables their names, labels, etc
12
Variable View
- Click on Variable View
- Tab (located lower left hand corner)
- Pages 12 13 of your handout
- Variable Name
- Numeric
- Width
- Decimal
- Variable Label
- Value Label
- Missing
- Column
- Align
- Measure
13
Variable View
- Variable View
- Tab (located lower left hand corner)
- Pages 12 13 of your handout
- Variable Name
- Numeric
- Width
- Decimal
- Variable Label
- Value Label
- Missing
- Column
- Align
- Measure
14
Open a new data file
- Now we are going to open up a data set.
- File gt open gt Data
- Navigate to your desktop
- Open up the data file that you downloaded from
our website.
15
Overview of Next Section of Workshop
- Transforming Variables
- Syntax File
- Descriptive Statistics
- Central Tendency
- Dispersion (Variability)
- Presentation of Data tables figures
- Making inferences to a Population
- Relationships and Statistical Tests
- Cross-tabulations and Chi Square
- Correlations
- Independent Sample t-test
- Other Useful information in packet
16
Transforming Variable (p 14)
- Recode
- Data may be need to be recoded for a variety of
reasons - Examples
- Common for reversing the scales
- Converting a continuous variable into discrete
ordinal variable - Transform gt Recode gt Into Different Variables
- Computing a New Variable
- Can create new variables that may be a function
of pre-existing variables - Transform gt Compute
- Instead of clicking ok, you have the option of
clicking on the paste button. - The paste button pastes the command language in a
syntax file. (This will be discussed shortly)
17
Transforming Variable (p 14)
- Recode
- Data may need to be recoded for a variety of
reasons - Examples
- Common for reversing the scales
- Converting a continuous variable into discrete
ordinal variable - Transform gt Recode gt Into Different Variables
- Computing a New Variable
- Can create new variables that may be a function
of pre-existing variables - Transform gt Compute
18
Thanks for having us ?We will see you next week.
- Do keep the Research Attitudinal Survey you
filled out. - Please bring back your packets next week.
- Please close SPSS log off your computer.
- Please turn in the SPSS Workshop Evaluation as
you leave the room.
Have a good day. ?
19
Financial Stability Composite Scale
- Person A has extremely low financial stability.
- How do you think he would answer questions f01
through f05? - SD D A SA?
- However, person B owns a very profitable
business. - How do you think she would answer items f01
through f05 ? - SD D A SA?
20
Financial Stability Composite Scale
21
Financial Stability Composite Scale
22
Financial Stability Composite Scale
23
Financial Stability Composite Scale
24
Financial Stability Composite Scale
25
Financial Stability Composite Scale
26
Health Service Accessibility Composite Scale
- What if person B also has high Health Service
Accessibility ? - She has great medical benefits and can get free
services from her sisters medical practice - How do you think she would answer the Access to
Health Service questions?
27
Health Service Accessibility Composite Scale
28
Health Service AccessibilityComposite Scale
29
Health Service AccessibilityComposite Scale
30
Reverse Scoring
- What is the reverse scores for h10?
revh10
h10
1 2 3 4
4 3 2 1
? ? ? ?
31
Look at the SPSS in data view
- What is the variable called revh10?
- Reverse of h10
- "cannot get the medicines I need" with scoring
reversed. - What is the variable finance?
- Finance Composite f01f02f03f04f05
- Construct Financial Stability
- What is the variable health?
- Heath Composite h06 h07 h08 h09 revh10
- Construct Accessibility to Health Services
32
Syntax command language (p15)
- A syntax file is simply a text file that contains
commands. - SPSS provides a powerful command language that
allows you to save and automate many common
tasks. - The command language also allows you to save your
jobs in a syntax file so that you can repeat your
analysis at a later date - While it is possible to open a syntax window and
type in commands, it is often easier if you let
the software help you build your syntax file - Instead of clicking OK, you can click on Paste
33
When should you use Syntax?
- You want to keep a record of what you did
- When you are still collecting data
- Intervention research pre post
- You have quite a bit of composite scores to
create - When you are repeating a type of analyses over
and over again.
34
Syntax File (optional)
- When you click on paste, a new window, called
syntax, appears. - The command language is copied onto the syntax
file. - If you highlight the language and click on run
or on the arrow button, the command file will be
executed
35
Syntax File (optional)
- Sometimes it is helpful to organize the syntax
file by typing in notes. - So that SPSS wont read the notes as command, you
should type in asterisks preceding your notes. - For example,
- Scoring for finance variables
- Make sure there is a space between your notes and
the commands - After commands have been created (or pasted),
make sure you put in a space after the commands - that way, additional commands will be pasted a
line below the previous commands. - After you are done doing a set of functions or
the same type of analyses, dont forget to save,
name, and close the syntax file - You may want to name the file relating to the
type of commands it is doing. - For example, scoring.
36
Lets Create a Composite Score
- Make sure that you are in data view tab
- Click on Transform gt Compute
37
(No Transcript)
38
(No Transcript)
39
(No Transcript)
40
(No Transcript)
41
(No Transcript)
42
(No Transcript)
43
(No Transcript)
44
(No Transcript)
45
(No Transcript)
46
(No Transcript)
47
(No Transcript)
48
(No Transcript)
49
Overview Analyzing Data Creating Graphs
- Level of Measurement
- Descriptive Analysis
- Presentation of Data
- Central Tendency Variability
50
What are the Levels of Measurement? (p. 16)
Ratio
- (e.g., income, weights, volumes,
capacities, rates) - Different categories
- Rankable categories
- Constant equal-sized Intervals
- Absolute Zero (physical significance) (e.g.,
temperature in Kelvin, time) - construct a meaningful fraction (or ratio) with a
ratio variable
Interval
- (e.g.., age)
- Different categories
- Rankable categories
- Constant equal-sized Intervals
- can be expressed numerically
- the distance between attributes does have meaning
Ordinal
- (e.g.., education attainment, class
status) - Different Categories
- Categories are rankable (attributes can be
rank-ordered) - Intervals are NOT equal-sized
- Is the distance between 1 and 2, the same as
between 3 and 4? - Distances between attributes do not have any
meaning. - We don't assume a value of 2 means that HS
degree are twice something than less than HS.
Nominal
- (e.g.., sex, ethnicity, agency,
location) - Different Categories
- numerical values just "name" the attribute
uniquely - NOT Rankable
- We don't assume that higher values mean "more" of
something and lower numbers signify "less".
51
Temperature Example
Kelvin is a temperature scale designed so that
zero degrees K is defined as absolute zero (all
molecular movement stops and all actual
temperatures are above absolute zero)
52
Descriptive Statistics
- Presentation of entire distribution
- Frequency Distribution organized tabulation of
the number (or percentage) of individuals in each
category on the scale of measurement - Can be presented in a table or in a graph
- Measures of Central Tendency
- Identifies a single score that represents an
entire data set - Best example of average or most typical score
- Measures of Variability (Dispersion)
- Provides a description of how spread out the
scores are in a distribution - Provides a measure of how accurately a single
score selected from a distribution represents the
entire set
53
Presentation of entire distribution of a variable
54
Central Tendency and Dispersion
55
Central Tendency and Dispersion
56
Back to SPSS
- Create table frequency a chart
- Create measures of central tendency
- Create measures of dispersion
57
How can we summarize the distribution of the
below variable?
- Gender
- Male
- Female
What is the level of measurement? (see page 16,
1st slide)
Nominal
Should we use a bar graph or a histogram? (see
page 16, 2nd slide)
Bar Graph
58
Presentation of an Nominal Variable
- Click Analyze gt click Descriptive Statistics gt
then click Frequencies. - You should see a dialog box called Frequencies.
- On the left side you should see a list of
variables and on the right you should see a
Variable(s) box. - In the variable list (left side) look for a
variable either called Gender or sex. - Select this variable by clicking on it, then
click ?to place the variable in the Variable(s)
box. - Make sure that there is a check mark next to
Display frequency tables. - Click Charts.
- You will see a dialog box called Frequencies
Charts - Click Bar Charts. Click Continue.
- Click OK.
59
(No Transcript)
60
(No Transcript)
61
Dialogue box called Frequencies
62
(No Transcript)
63
Frequency and Percentage Distribution of Gender
(N96)
Missing Cases 2
64
(No Transcript)
65
We want to know the central tendency for the
below variables. (p 18)
- Age of respondent
- 18 89. Actual age in years
What is the level of measurement?
Which measure of central tendency should we use?
(see page 16, 3rd slide)
66
Central Tendency Variability for Interval
Ratio Variable
- Click Analyze gt click Descriptive Statistics gt
then click Descriptive. - You will see a dialog box called Descriptives.
- Select the variable
- one is called AGE.
- Click Options. You will see a dialog box called
Descriptives Options - By default Mean, Std Deviation, Minimum,
Maximum should be selected - click Continue.
- Click OK.
67
Mean and Standard Deviation of Age (N96)
68
Mean Comparisons
- Lets say we want to see if males and females
differ in their financial stability. - In SPSS we can compare the mean financial
stability between gender categories
69
Mean Comparison
70
Mean Comparison
- The left side contains the list of variables from
the data set. - You can scroll down to find the two variables
- Sex (gender) and Financial Stability.
- After choosing a variable you can move it into
one of the boxes on the right. - Dependent List
- Independent List
- Which variable is the dependent variable? Sex or
Financial Stability? - Which variable is the independent variable?
71
Mean Comparison
72
Mean Comparison
73
Mean Comparison Output Window
74
Mean Comparison Output
75
Summary of what we have discussed.
- Presentation of the variable distributions
- Central tendency
- Variability (dispersion)
- Comparing means across groups
76
Inferential Statistics (p 19)
- Techniques that allow us to study samples and
then make generalizations about the population
from which they were selected. - Sample a set of individuals selected from a
population, usually intended to represent the
population in a research study. - Population The collection of all individuals
(cases) in which the researcher is interested.
77
Statistical Significance
- Statistical Significance (probability)
- Probability is used to predict what kind of
samples are likely to be obtained from a
population. - Probability establishes a connection between
populations and samples - Relying on this connection, inferences of
populations can based on sample statistics
78
Research Question
- Actual research is conducted using a sample
- Hypothesis test a statistical method that uses
sample data to evaluate a hypothesis about a
population parameter. - Hypotheses are stated in terms of population
parameters - Research Hypotheses, for example,
- There is a relationship between age financial
stability. - There is an financial differences between males
and females (i.e., There is an gender effect on
financial stability) - There is a change or a difference between pre and
post test scores
79
Research Questions the Applicable Statistical
Procedures
- Relationships
- Chi-square
- Correlation
- Regression
- Differences between 2 sample means
- Independent samples
- Independent t-test
- Dependent samples
- Paired-sample t-test
- Differences among 2 or more independent sample
means - Analysis of Variance (ANOVA)
80
Relationship
- Science involves a search for relationships
between variables. For example, is there is a
relationship between the amount of rainfall and
crop growth? - Sometimes, it is reasonable to expect a
consistent, orderly relation between two
variables As X changes, Y also changes in a
predictable way.
81
Linear Relationships with SPSS
- Two options
- Regression Analysis
- Analyze gt Regression gt Linear
- Correlation Coefficient (simpler)
- Analyze gt Correlate gt Bivariate
- Scatter Plot
- Graphs gt Scatter gt Simple ...
82
Correlation
83
Scatter Plot Example of a Positive Relationship
84
Creating a contingency table and computing a
chi-square (?2)
85
Creating a contingency table and calculating a ?2
- Choose Chi-square
- Put one of the variables in Row(s) and the other
variable in Column(s) - Click on button called Statistics
86
Contingency Table and Chi-Square
87
Two Sample t Tests with SPSS
- Independent-Samples t Test (Sex res_pre)
- Analyze gt Compare Means gt Independent-Samples T
Test - t test
- If p lt .05 then significant
- Paired-Samples t Test (usually for pre post
test) - Analyze gt Compare Means gt Paired-Samples T Tests
- t test
- If p lt .05 then significant
88
Independent-Samples t Test Output
89
Paired-Samples t Test Output
90
Differences among 2 or more independent sample
means with SPSS
- Analysis of Variance
- Analyze gt Compare Means gt One-Way ANOVA
- F test
- If p lt .05 then significant
91
Helpful Pages in Your Packet
- APA Outline of Empirical Research Paper (pp 5-7)
- SPSS Statistics Cheat Sheet (pp 23-24)
- Printing Output (p26)
- Print Preview
- You can print only part of the output, by first
selecting (single clicking) a particular output - Sometimes you may want to set up the page as
landscape before printing - AFS network Space (p 27)
- Backing up your files to your server space via
internet
92
Stat Lab Resources
- 12 PC computers, printer (free printing), and
copier (limited use) - Office supplies (stapler, 3-hole puncher, paper
clips) - Reference library (books can not leave the Stat
Lab) - Introductory text books on Statistics Research
Methods - Publication manual of the American Psychological
Association - Presenting your findings a practical guide for
creating tables - Displaying your findings a practical guide for
creating figures, posters, and presentations - Using SPSS for Windows Macintosh analyzing
understanding data analyses (helpful in
interpreting the results and writing it in APA
format)
93
Review of Workshop
- Overview of Research Process
- Introduction to SPSS
- Input importing raw data
- Editing raw data
- Transforming reversing items and creating
composite scores - Introduction to the Syntax File
- Analyzing Data Create Graphs with SPSS
- Descriptive Statistics Level of Measurement
- Central Tendency
- Dispersion
- Presentation of Data tables figures
- Inferential Statistics
- Stating Hypotheses
- Relationships
- Two sample t-tests Independent Paired
- ANOVA
94
Review of Workshop
- Overview of Research Process
- Introduction to SPSS
- Input importing raw data
- Editing raw data
- Transforming reversing items and creating
composite scores - Analyzing Data Create Graphs with SPSS
- Level of Measurement Descriptive Statistics
- Central Tendency
- Dispersion
- Presentation of Data tables figures
- Comparing Means across groups (e.g., gender)
- Correlations
95
Thanks for having us as your guests ?
- We have to justify the Stat Lab conducting SPSS
workshops. - Could you please fill out the SPSS workshop
Evaluation at last page of the packet. - If would please write comments about
- what you like most of the workshop,
- what you have learned about the workshop,
- how we may be able to improve it.
- We will greatly appreciate it.
- Thank You,
96
Thanks for having us as your guests ?
- Do keep the Research and Statistics
Attitude Survey you filled out. - Please turn in the SPSS Workshop
Evaluation. You can drop off this evaluation
near the door, or at front table. - Please come and visit
- the Stat Lab (CLCC 107)
Have a good day. ?
97
Thanks for having us ?
- Do keep the Financial and Health Attitude
Survey you filled out. - Please close SPSS log off your laptop. If
the laptop logged you off or automatically shut
off, please turn back on and put in your password
so that the computer can be properly shutdown. - However, please turn in the SPSS Workshop
Evaluation 2. After you have completed the
survey please come up and leave the survey by the
front table or desk. - Your professor may still need to continue with
class, so please dont leave yet. - Please come and visit the Stat Lab (CLCC 107).
Have a good day. ?
98
Thanks for having us ?
- Do keep the Financial and Health Attitude
Survey you filled out. - Please close SPSS log off your computer.
- Your professor may still need to continue with
class, so please dont leave yet. - However, please turn in the SPSS Workshop
Evaluation 2. After you have completed the
survey please come up and leave the survey by the
front table or desk. - Please come and visit the Stat Lab (CLCC 107).
Have a good day. ?