
Hiawatha Light Rail Transit: A Cost-Benefit Analysis
Title:
Hiawatha Light Rail Transit: A Cost-Benefit Analysis
Description:
Bad News. Discount rate. Capital costs. Time savings. Reduced crash risk. Avoided auto costs. Operating costs. First the good news... Source: NBC News, KARE11. ... – PowerPoint PPT presentation
Number of Views:160
Avg rating:3.0/5.0
Title: Hiawatha Light Rail Transit: A Cost-Benefit Analysis
1
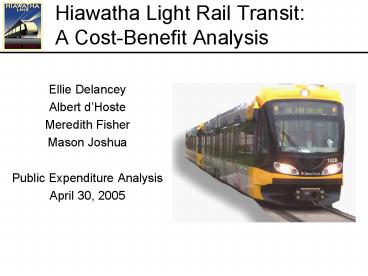
Hiawatha Light Rail TransitA Cost-Benefit
Analysis
- Ellie Delancey
- Albert dHoste
- Meredith Fisher
- Mason Joshua
- Public Expenditure Analysis
- April 30, 2005
2
Presentation Structure
- Project Background
- Benefits
- Costs
- Synthesis
- Conclusion
3
WHAT IS A LIGHT RAIL TRANSIT?
- Lightweight passenger rail cars operating on a
two-rail - track similar to railroad tracks
- Driven electronically with power drawn from an
- overhead electric line
- Usually runs on the street with the right of way
4
GOALS FOR THE HIAWATHA LIGHT RAIL
- Expand travel options throughout the City of
Minnesota with the light rail transit service and
the alteration of select bus routes - Attract new business opportunities in the areas
linked by the light rail as well as provide a
more efficient means of transport for adjacent
businesses - Maintain nearby areas by incorporating the
advice of residents and businesses with standing
into the plans for land use and station area
development
http//www.ce.umn.edu/levinson/ce5212/Case8/CS8.h
tml
5
ALTERNATIVES TO A LIGHT RAIL TRANSIT LINE
- Do nothing
- Increase the frequency of buses and diversify the
routes
6
STATISTICS
- The light rail system is 12 miles long,
connecting downtown Minneapolis, Minneapolis/St.
Paul International Airport, and Mall of America
in Bloomington - 17 stations, 24 cars each 94 ft. long
- Top speed at 55mph with general service speed of
40mph and slower speed downtown
- Current ridership expected is approx. 19,300 per
weekday in 2005 - Timed transfers with buses
7
LRT ROUTE SELECTION
- Routes chosen based upon
- highly trafficked areas
- cost of construction
- ridership potential
- areas formerly serviced by railroad lines
8
PROJECT TIMELINE
Citizen transit supporters met to discuss the
need for rail transit service in Minnesota
Ground broken for Hiawatha LRT project
Began service to airport and Mall of America
2001
2003
1997
1995
1999
2002
2004
2000
1998
1996
First segment of Hiawatha LRT opened
State funding for light rail obtained
(not to scale)
9
FINANCING FOR HIAWATHA LRT
The Hiawatha LRT was financed through federal and
local grants.
Source http//www.metrocouncil.org/transportation
/lrt/lrt-overview.htm
10
FINANCING FOR HIAWATHA LRT (cont.)
a different perspective on the LRT financing
11
Benefits
12
Benefits
- Quantitative
- Supplementary
- Qualitative
- Methodology
13
BenefitsI. Quantitative
In millions of s
source Final Hiawatha Corridor LRT Benefit-Cost
Analysis, Minnesota Dept. of Transportation,
Office of Investment Management 1999
14
BenefitsII. Supplementary
In millions of s
- Depends entirely on altered behavior, which is
difficult to predict
source Final Hiawatha Corridor LRT Benefit-Cost
Analysis, Minnesota Dept. of Transportation,
Office of Investment Management 1999
15
BenefitsIII. Qualitative
- Stimulate urban redevelopment
- Provide transportation for low income travelers
- Serve as the catalyst towards a more
comprehensive transit network - Promote transit-oriented development
- centralized business and residential zones
encourage transit use, lessening dependence on
autos
16
BenefitsIV. Methodology Travel Time Savings
- Largest benefit by far
- Less congestion
- Time savings for both drivers and LRT riders
222,664 hours x 9.12
7.9 minutes saved per ride
17
BenefitsMethodology Remaining Capital Value
- Bulk of capital value derived from facilities
- Utility relocation benefits private and public
utility companies
In millions of s
18
BenefitsMethodology Avoided Auto Op. Costs
(4,173,765 VMT x 0.26) discount factor
- Parked cars dont need gas and depreciate less
19
BenefitsMethodology Bus Crash Avoidance
-
- Why assume a reduction in bus VMTs at all?
- Bus ridership actually increased in five LRT
cities
20
BenefitsMethodology Car Crash Avoidance
-
- Parked cars cant wreck
21
BenefitsMethodology Pollution Reduction
Decreased auto usage ? less emissions Economic
benefits ?reduced health care costs associated
with pollution
x
22
Unadjusted Total Benefits
Unadjusted Total Benefits 318.1 million
23
Costs
24
Costs
- Breakdown
- Methodology
25
CostsI. Breakdown
(in millions)
Source Minnesota Dept of Transportation Office
of Investment Management
26
CostsII. Methodology Capital Costs
Source Minnesota Dept of Transportation Office
of Investment Management
27
CostsMethodology Operating Costs
Source Minnesota Dept of Transportation Office
of Investment Management
28
Operating costs Methodology (contd)
- LRT Operating costs are in 1999 dollars per
- year.
- The inflation rate assumed was 2
- Also, the following real discount rate was used
3.3 (inclusive of the inflation rate above)
29
CostsMethodology Other Costs
- The next table explains how these costs were
calculated.
Source Minnesota Dept of Transportation Office
of Investment Management
30
Total Costs
Source Minnesota Dept of Transportation Office
of Investment Management
31
Synthesis
32
Synthesis testing the core assumptions
- Good News
- Ridership projections
- Bad News
- Discount rate
- Capital costs
- Time savings
- Reduced crash risk
- Avoided auto costs
- Operating costs
33
- First the good news
34
Actual ridership figures were higher than
projected
- Since opening on June 26, 2004, customers have
taken 2.9 million rides, which is double the
estimated projection - Ridership has been so high that 3 new light rail
cars were purchased - Nearly 40 are new to public transit
Source Light Rail Now NewsLog. Minneapolis
Nearly 40 of light rail riders are new to
transit. February 16, 2005. www.lightrailnow.org/n
ews/n_newslog002.htmMIN_20050216
35
- And now the bad news
36
The discount rate chosen inflates benefits and
deflates costs
The conservative estimate is closer to the real
opportunity cost of capital, which reflects the
market rate of investment
Source Minnesota Department of Transportation.
Final Hiawatha Corridor LRT Benefit-Cost
Analysis. November 4, 1999
37
Capital costs were likely higher than projected
- Project approved at 400 million in 1997 since
then it has grown to 715 million - Officials say the expansion was a result of
changes and added features, not overspending - But, overspending is in the eye of the
beholder - If you keep changing the number, then of what
significance is thatwe will never know how much
it costs. Rep. Phil Krinkie, R-Shoreville
Source Duluth News Tribune, Project officials
say light-rail line to arrive on budget.
July 13, 2004
38
Time savings either zero or negative
- Almost immediately after the rail opened,
motorists noticed a significant increase in
congestion - Planners programmed traffic lights to give
priority to trains previously lights were
synchronized to speed traffic flow with minimal
stops - The effect an additional 10-20 minute commute
for those commuting on Highway 55
Source Duluth News Tribune. Light rail could
mean worse traffic in south Minneapolis.
June 25, 2004
39
Time savings estimates have a dramatic effect on
benefit/cost ratio
Decrease from 0.42!
40
Reduced crash risk benefits either zero or
negative
- According to Federal Highway Transportation
experts - Drivers have responded to long waits with
U-turns and signal violations, creating
"potential severe safety issues". - Thus, because of signal timing and congestion
issues, crash risk has actually increased!
Source NBC News, KARE11. Report Light Rail
Slows Street Traffic www.kare11.com/news/news_arti
cle.aspx?storyid72841
41
Higher ridership has low effect on avoided auto
operating costs
Estimates assume double the rate of growth (3.6
vs. 1.8) and the increased actual ridership
estimates
42
Avoided auto operating costs are overestimated
- Planners assumed that cars cost 26 per mile to
operate - However, this estimate includes variable costs
like gasoline and fixed costs like insurance - About half of the cost of a car is fixed
So, unless light rail causes people to sell their
cars, then the estimate should be cut in half
from 66.3 million to 32.15 million
Source Capital Roundup. Committee on State
Government Finance learns more about light rail.
December 9, 1999. www.hometownsource.com/capitol/
1999/december/1209.html
43
Operating costs were double discounted!
So, the proper estimate should be twice the
reported figure, or 334.8 million.
Source Minnesota Department of Transportation.
Final Hiawatha Corridor LRT Benefit-Cost
Analysis. November 4, 1999
44
Conclusions
45
Adjusted Total Benefits
Adjusted Total Benefits 135.7 million
46
Adjusted Total Costs
Adjusted Total Costs 932.8 million
47
So what is really going on here?
Account for majority of benefits, not very
sensitive to higher ridership estimates
Bulk of funding provided by federal government
Underreported potentially drains funds from bus
system
48
Summary
- The Hiawatha LRT system was built despite low
economic returns to society - Original report estimated only 42 in benefits
for every dollar spent - Our analysis shows that only 15 in benefits for
each dollar spent - Qualitative benefits won out
- Smart growth/livable communities denser
region-wide land use - Economic development, increased business
productivity - Symbolic Minneapolis/St. Paul as a world-class
city - And if you can get federal and state governments
to fund you, then why not?! - Guaranteed federal funding of 50 of capital
costs through New Starts - Less than 1/3 of capital cost covered by local
funds, and 40 of operating costs to be funded by
the State
Recommended
CrystalGraphics Presentations


