
CDMP Storm Hazard Atlas: Anguilla - PowerPoint PPT Presentation
Title:
CDMP Storm Hazard Atlas: Anguilla
Description:
Anguilla. Ross Wagenseil. for CDMP. March 2000. CDMP. 17.8 N ... Anguilla. St. Martin. St. Bart. St. Maartin ... Anguilla & Vicinity. Probable Storm Effects ... – PowerPoint PPT presentation
Number of Views:132
Avg rating:3.0/5.0
Title: CDMP Storm Hazard Atlas: Anguilla
1
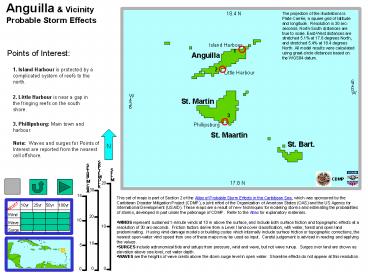
Anguilla Vicinity Probable Storm Effects
The projection of the illustrations is Plate
Carrée, a square grid of latitude and longitude.
Resolution is 30 arc-seconds. North-South
distances are true to scale. East-West distances
are stretched 5.1 at 17.8 degrees North, and
stretched 5.4 at 18.4 degrees North. All model
results were calculated using great-circle
distances based on the WGS84 datum.
Anguilla
Ross Wagenseil for CDMP January 2000
Island Harbour
Points of Interest
1
Anguilla
2
1. Island Harbour is protected by a complicated
system of reefs to the north.
Little Harbour
2. Little Harbour is near a gap in the fringing
reefs on the south shore.
St. Martin
3
3. Phillipsburg Main town and harbour.
Phillipsburg
N
St. Maartin
St. Bart.
Note Waves and surges for Points of Interest
are reported from the nearest cell offshore.
- This set of maps is part of Section 2 of the
Atlas of Probable Storm Effects in the Caribbean
Sea, which was sponsored by the Caribbean
Disaster Mitigation Project (CDMP), a joint
effort of the Organization of American States
(OAS) and the US Agency for International
Development (USAID). These maps are a result of
new techniques for modeling storms and
estimating the probabilities of storms, developed
in part under the patronage of CDMP. Refer to
the Atlas for explanatory materials. - WINDS represent sustained 1-minute winds at 10 m
above the surface, and include both surface
friction and topographic effects at a resolution
of 30 arc-seconds. Friction factors derive from
a Level I land-cover classification, with water,
forest and open land predominating. If using
wind damage models or building codes which
internally include surface friction or
topographic corrections, the nearest open-water
wind speed from one of these maps may be used as
input. Careful judgement is advised in reading
and applying the values. - SURGES include astronomical tide and setups from
pressure, wind and wave, but not wave runup.
Surges over land are shown as elevation above sea
level, not water depth. - WAVES are the heights of wave crests above the
storm surge level in open water. Shoreline
effects do not appear at this resolution.
2
Winds
10-Year Return Time
Anguilla vicinity
1
2
1. Island Harbour 32 m/s
2. Little Harbour 31 m/s
3
3. Phillipsburg 31 m/s
N
3
Waves
10-Year Return Time
Anguilla vicinity
1
2
1. Island Harbour 3.9 m high, immediately to the
north
2. Little Harbour 3.4 to 3.9 m high, immediately
to the south and east
3
3. Phillipsburg 3.9 m
N
4
Surges
10-Year Return Time
Anguilla vicinity
1
2
1. Island Harbour 0.3 m high, immediately
offshore to the north
2. Little Harbour 0.3 m high, offshore to the
south and east
3
3. Phillipsburg 0.2 m
N
5
Winds
25-Year Return Time
Anguilla vicinity
1
2
1. Island Harbour 41 m/s
2. Little Harbour 40 m/s
3
3. Phillipsburg 40 m/s
N
6
Waves
25-Year Return Time
Anguilla vicinity
1
2
1. Island Harbour 5.1 m high, immediately
offshore to the north
2. Little Harbour 3.6 m to the south, 3.7 m to
the east, and 5.0 m immediately offshore to the
southeast.
3
3. Phillipsburg 4.9 m
N
7
Surges
25-Year Return Time
Anguilla vicinity
1
2
1. Island Harbour 0.6 m immediately offshore to
the north
2. Little Harbour 0.6 m to 0.7 m immediately
offshore
3
3. Phillipsburg 0.5 m
N
8
Winds
50-Year Return Time
Anguilla vicinity
1
2
1. Island Harbour 47 m/s
2. Little Harbour 47 m/s
3
3. Phillipsburg 46 m/s
N
9
Waves
50-Year Return Time
Anguilla vicinity
1
2
1. Island Harbour 5.9 m high offshore
2. Little Harbour 3.8 m high near shore, 5.4 m
high a little farther out
3
3. Phillipsburg 5.1 m
N
10
Surges
50-Year Return Time
Anguilla vicinity
1
2
1. Island Harbour 0.9 m high immediately offshore
2. Little Harbour 0.9 m high, immediately
offshore
3
3. Phillipsburg 0.8 m
N
11
Winds
100-Year Return Time
Anguilla vicinity
1
2
1. Island Harbour 53 m/s
2. Little Harbour 53 m/s
3
3. Phillipsburg 53 m/s
N
12
Waves
100-Year Return Time
Anguilla vicinity
1
2
1. Island Harbour 6.8 m high offshore
2. Little Harbour 4.1 m at the shore, 5.6 m high
a little farther out
3
3. Phillipsburg 5.3 m
N
13
Surges
100-Year Return Time
Anguilla vicinity
1
2
1. Island Harbour 1.2 m high at the shore
2. Little Harbour 1.3 m high at the shore
3
3. Phillipsburg 1.0 m
N