
Integration of Metabolism - PowerPoint PPT Presentation
1 / 38
Title:
Integration of Metabolism
Description:
Integration of Metabolism Interconnection of pathways Metabolic profile of organs Food intake, starvation and obesity Fuel choice during exercise – PowerPoint PPT presentation
Number of Views:339
Avg rating:3.0/5.0
Title: Integration of Metabolism
1
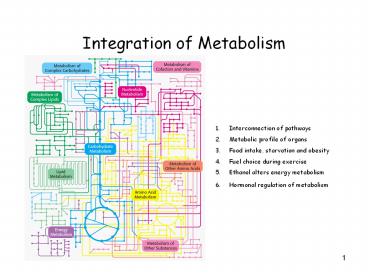
Integration of Metabolism
- Interconnection of pathways
- Metabolic profile of organs
- Food intake, starvation and obesity
- Fuel choice during exercise
- Ethanol alters energy metabolism
- Hormonal regulation of metabolism
2
Connection of Pathways
- ATP is the universal currency of energy
- ATP is generated by oxidation of glucose, fatty
acids, and amino acids common intermediate -gt
acetyl CoA electron carrier -gt NADH and FADH2 - NADPH is major electron donor in reductive
biosynthesis - Biomolecules are constructed from a small set of
building blocks - Synthesis and degradation pathways almost always
separated -gt Compartmentation !!!
3
Key Junctions between Pathways
4
Metabolic Profile of Organs
5
1. Metabolic Profile of Brain
Glucose is fuel for human brain -gt consumes
120g/day -gt 60-70 of utilization of glucose in
starvation -gt ketone bodies can replace glucose
6
2. Metabolic Profile of Muscles
Major fuels are glucose, fatty acids, and ketone
bodies -gt has a large storage of glycogen -gt
about ¾ of all glycogen stored in muscles -gt
glucose is preferred fuel for burst of activity
-gt production of lactate (anaerobe) -gt fatty acid
major fuel in resting muscles and in heart muscle
(aerobe)
7
3. Metabolic Profile of Adiposite tissue
Triacylglycerols are stored in tissue -gt enormous
reservoir of metabolic fuel -gt needs glucose to
synthesis TAG -gt glucose level determines if
fatty acids are released into blood
8
4. Metabolic Profile of Kidney
Production of urine -gt secretion of waste
products Blood plasma is filtered (60 X per day)
-gt water and glucose reabsorbed -gt during
starvation -gt important site of gluconeogenesis
(1/2 of blood glucose)
9
5. Metabolic Profile of the Liver (Glucose)
Essential for providing fuel to brain, muscle,
other organs -gt most compounds absorpt by diet
-gt pass through liver -gt regulates metabolites
in blood
10
Metabolic Activities of the Liver (Amino Acids)
a-Ketoacids (derived from amino acid degradation)
-gt livers own fuel
11
Metabolic Activities of the Liver (Fatty Acids)
cannot use acetoacetate as fuel -gt almost no
transferase to generate acetyl-CoA
12
Food Intake, Starvation, and Obesity
- Normal Starved-Fed Cycle
- Postabsorptive state -gt after a meal
- Early fasting state -gt during the night
- Refed state -gt after breakfast
- -gt Major goal is to maintain blood-glucose level!
13
Blood-Glucose
14
- Postabsorptive state
Glucose Amino acids -gt transport from intestine
to blood Dietary lipids transported -gt lymphatic
system -gt blood Glucose stimulates -gt secretion
of insulin Insulin -gt signals fed state -gt
stimulates storage of fuels and synthesis of
proteins -gt high level -gt glucose enters muscle
adipose tissue (synthesis of TAG) -gt stimulates
glycogen synthesis in muscle liver -gt
suppresses gluconeogenesis by the liver -gt
accelerates glycolysis in liver -gt increases
synthesis of fatty acids -gt accelerates uptake of
blood glucose into liver -gt glucose 6-phosphate
more rapidly formed than level of blood glucose
rises -gt built up of glycogen stores
15
Insulin Secretion Stimulated by Glucose Uptake
16
Postabsorptive State -gt after a Meal
17
2. Early Fasting State
Blood-glucose level drops after several hours
after the meal -gt decrease in insulin secretion
-gt rise in glucagon secretion Low blood-glucose
level -gt stimulates glucagon secretion of a-cells
of the pancreas Glucagon -gt signals starved
state -gt mobilizes glycogen stores (break
down) -gt inhibits glycogen synthesis -gt main
target organ is liver -gt inhibits fatty acid
synthesis -gt stimulates gluconeogenesis in
liver -gt large amount of glucose in liver
released to blood stream -gt maintain
blood-glucose level Muscle Liver use fatty
acids as fuel when blood-glucose level drops
18
Early Fasting State -gt During the Night
19
3. Refed State
Fat is processed in same way as normal fed
state First -gt Liver does not absorb glucose
from blood (diet) Liver still synthesizes glucose
to refill livers glycogen stores When liver has
refilled glycogen stores blood-glucose level
still rises -gt liver synthesizes fatty acids from
excess glucose
20
Prolonged Starvation
Well-fed 70 kg human -gt fuel reserves about
161,000 kcal -gt energy needed for a
24 h period -gt 1600 kcal - 6000 kcal
-gt sufficient reserves for
starvation up to 1 3 months
-gt however glucose reserves are
exhausted in 1 day Even under starvation -gt
blood-glucose level must be above 40 mg/100 ml
21
Prolonged Starvation
First priority -gt provide sufficient glucose to
brain and other tissues that are dependent on
it Second priority -gt preserve protein -gt shift
from utilization of glucose to utilization of
fatty acids ketone bodies -gt mobilization of
TAG in adipose tissues gluconeogenesis by liver
-gt muscle shift from glucose to fatty acids as
fuel After 3 days of starvation -gt liver forms
large amounts of ketone bodies (shortage of
oxaloacetate) -gt released into blood -gt brain and
heart start to use ketone bodies as fuel After
several weeks of starvation -gt ketone bodies
major fuel of brain After depletion of TAG stores
-gt proteins degradation accelerates -gt death due
to loss of heart, liver, and kidney function
22
(No Transcript)
23
Mobilization at Starvation
Also at not treated diabetes
24
Diabetes Mellitus Insulin Insufficiency
- Characterized by -gt high blood-glucose level
- -gt Glucose overproduced by liver
- -gt glucose underutilized by other organs
- -gt shift in fuel usage from carbohydrates to fats
-gt keton bodies (shortage of oxaloacetate) - -gt high level of keton bodies -gt kidney cannot
balance pH any more -gt lowered pH in blood and
dehydration -gt coma - Type I diabetes insulin-dependent diabetes
(requires insulin to live) - caused by autoimmune
destruction of ß-cells - begins before age 20
- -gt insulin absent -gt
glycagon present - -gt person in
biochemical starvation mode high blood-glucose
level - -gt entry of glucose
into cells is blocked - -gt glucose excreted
into urine -gt also water excreted -gt feel hungry
thirsty - Type II diabetes insulin-independent diabetes
- have a normal-high
level of insulin in blood -gt unresponsive to
hormone - develops in
middle-aged, obese people
25
Obesity
Mouse lacking leptin or Leptin receptor
In the U. S. -gt about 70 of adults are suffering
from obesity (2009) Risk factor for Diabetes
Cardiovascular diseases Cause of Obesity -gt more
food consumed than needed -gt storage of energy as
fat Two important signals for caloric
homeostasis and appetite control -gt insulin
leptin
26
(No Transcript)
27
The Role of Leptin and Insulin on Weight Control
Leptin is a hormone that is produced in direct
proportion to fat mass (adipocytes)
28
High Levels of Leptin and Insulin are a Signal
for caloric homeostasis
29
Obese People Produce More Heat
- Body can deal with excess calories
- Storage
- Extra exercise
- Production of heat
30
Fuel Choice During Exercise
Fuels used are different in -gt sprinting -gt
anaerobic exercise -gt lactate -gt distance running
-gt aerobic exercise -gt CO2 ATP directly powers
myosin -gt responsible for muscle contraction -gt
movement -gt amount of ATP in muscle is small -gt
velocity depended on rate of ATP production -gt
creatine phosphate generates ATP under intense
muscle contractions for 5-6 s Sprint powered by
ATP, creatine phosphate, and anaerobic glycolysis
of glycogen -gt lactate Medium length sprint
complete oxidation of muscle glycogen -gt CO2
(production slower) -gt velocity lower Marathon
complete oxidation of muscle and liver glycogen
-gt CO2 and complete oxidation
of fatty acids from adipose tissues -gt CO2 (ATP
is generated even slower) Low
blood-glucose level -gt high glucagon/insulin
ratio -gt mobilization of fatty acids
31
(No Transcript)
32
(No Transcript)
33
Ethanol Alters Energy Metabolism in Liver
- Consumption of EtOH in excess -gt number of health
problems - EtOH has to be metabolised
- EtOH NAD -gt Acetaldehyde NADH
(alcohol dehydrogenase, in cytoplasm) - Acetaldehyde NAD -gt Acetate NADH
(aldehyde dehydrogenase, in mitochondria) - -gt EtOH consumption leads to accumulation of NADH
- High level NADH causes
- -gt inhibition of gluconeogenesis (prevent
oxidation of lactate to pyruvate) -gt lactate
accumulates - -gt inhibits fatty acid oxidation -gt stimulates
fatty acid synthesis in liver -gt TAG accumulates
-gt fatty liver - -gt inhibition of citric acid cycle
- Ethanol inducible microsomal ethanol-oxidizing
system (MEOS) -gt P450 dependent pathway -gt
generates free oxygen radicals -gt damages tissues
- Acetate is converted into Acetyl CoA -gt
processing of Acetyl CoA by citric acid cycle is
blocked by high amounts of NADH -gt Ketone bodies
are generated and released into the blood -gt
further drop of pH - Processing of acetate in liver inefficient -gt
high level of acetaldehyde in liver -gt reacts
with proteins -gt become inactive -gt damage liver
-gt cell death - Liver damage in 3 stages Development of Fatty
Liver -gt alcoholic hepatitis (groups of cells
die) -gt cirrhosis (no convertion of Ammonium -gt
urea)
34
Hormonal Regulation of Metabolism
35
Action of Different Hormones
36
Hormone signals and their target tissues
37
Cascade of Hormone Release Following Central
Nervous System Input to the Hypothalamus
- Cortisol
- Signals stress !!!
- signals low blood glucose -gt counterbalances
insulin
38
Epinephrine -gt Signals Stress -gt requires
activity -gt Fighting or Fleeing
Recommended
CrystalGraphics Presentations


