
The Oxygen Transport System - PowerPoint PPT Presentation
1 / 52
Title:
The Oxygen Transport System
Description:
INTRODUCTION I. Pulmonary Ventilation Movement of Air in & out of the Lungs A. Minute Ventilation . V The amount of Air ventilated by the lungs in one Minute . – PowerPoint PPT presentation
Number of Views:161
Avg rating:3.0/5.0
Title: The Oxygen Transport System
1
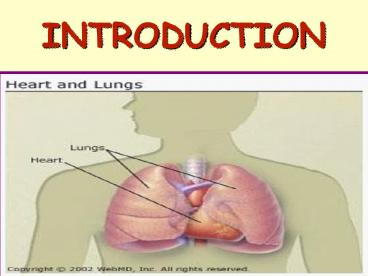
INTRODUCTION
2
The Oxygen Transport System
3
I. Pulmonary VentilationMovement of Air in out
of the Lungs
3
4
A. Minute Ventilation . VThe amount of Air
ventilated by the lungs in one Minute.
VEVolume Expired in One Minute
4
5
Tidal Volume (TV)The volume of Air ventilated
per BreathFrequency (f)The Number of
Breaths/minuteVE TV x fMinute ventilation
TV x f
5
6
Ventilation during Exercise
REST
Exhaustion
6
7
Ventilation as a Limit to Performance
- Performance is not limited by ventilation
- Ventilation will INCREASE out of proportion to
workload so that - Ventilation becomes greater than
Necessary-HYPERVENTILATION - - excessive movement of air in out caused by
increased depth and frequency of breathing and
resulting in elimination of CO2
7
8
II. Alveolar Ventilation
AIR (O2) into lungs Alveoli
blood Tiny air sacs deep in lung which have
contact with the Pulmonary Capillaries to
exchange gases
8
9
II. Alveolar Ventilation
DEAD SPACE
those areas of the body that air enters but does
not go into the alveoli - hence - NO GAS EXCHANGE
9
10
Ventilation and Smoking
- Shortness of Breath
- Increased Airway Resistance
- Respiratory Muscles work Harder to ventilate
- - thus, these muscles require MORE Oxygen
- Results in LESS Oxygen for Skeletal Muscles
10
11
Ventilation and Smoking
- Pulmonary Ventilation
- Endurance
- MAXIMUM Oxygen Consumption
VO2max the max rate at which O2 can be
consumed per minute
11
12
Second Wind
- Sudden transition of feeling distress or fatigue
early in prolonged exercise to a more comfortable
feeling later in exercise - Possible Causes include
- slow ventilatory adjustments brought on by the
breathlessness felt early - Removal of lactic acid built early from delayed
blood flow changes - Relief from muscle fatigue
- Adequate Warm-up
- Psychological factors
12
13
Stitch in Side
- Occurs early in prolonged exercise and subsides
as exercise continues - Sharp Pain or Stitch in side or rib cage area
- May interfer w/ exercise- must stop
- Possible Causes include
- HYPOXIA or lack of O2 in Resp Muscles
- occurs more in Untrained athletes
13
14
II. GAS EXCHANGE
Exchange of Oxygen Carbon Dioxide between the
Air and Blood
- TWO TYPES
- Alveolar Capillary Membrane
- Tissue Capillary Membrane
14
15
Alveolar Capillary Membrane
Thin layer of tissue that separates air in Aleoli
from blood in Capillaries 1st EXCHANGE of O2 and
CO2
15
16
Capillary with RBC
Tissue Capillary Membrane
Thin capillary membrane between blood and tissues
in body 2nd EXCHANGE of O2 and CO2
16
17
GAS EXCHANGE by DIFFUSION
Movement of gases from higher concentrations to
lower concentrations
Diffusion Gradient pp of gas in highest conc.
Minus the pp of gas in venous blood
17
18
Partial PressureThe pressure exerted by gas in
relation to the or concentration of the gas
within a volume
At sea Level- alveolar pO2 100mmHbg 100 sat
Hbg
18
19
Diffusion Gradients dependent on Partial
pressures (p) of gas in 2 different areas
Blood pO2 LOW
Alveoli pO2 HIGH
Alveoli pCO2 LOW
Blood pCO2 HIGH
19
20
Diffusion Capacity in Athletes
- Alveolar- Capillary diffusion is greater during
max exercise in (endurance) athletes than
Nonathletes - see Table 8.5
20
21
NEW SECTION
22
Transport of Gases by the Blood
O2 and CO2 are carried in the blood
by 1.Chemical Combination-OXYHEMOGLOBIN Hb O2
HbO2 2. Dissolved in Plasma
22
23
Oxyhemoglobin
24
Oxyhemoglobin Dissociation Curve
Fig. 8.8- Relationship between Amt of HbO2 and
Partial Pressure of O2
Hb O2 Saturation Increases as Partial Pressure
of O2 Increases
23
25
Smoking and Oxyhemoglobin
Comparison of the oxygen dissociation curves of
normal blood, blood containing 20, 40 and 60
carboxyhemoglobin (COHb), and blood from a
severely anemic patient. 25
26
BLOOD DOPING or Blood Boosting
- The removal and then- reinfusion of blood
- Done to temporarily increase blood volume
- Overloading would then increase O2 and
theoretically lead to INCREASED Endurance - see Fig. 8.7- ability to run 5 miles faster
26
27
Transport of CO2
Carbon Dioxide Transport
CA
CO2 H2O
H2 CO2
Carbonic Acid
H2 CO2
H H-CO3
Bicarbonate ion
27
28
Carbon dioxide is carried in the blood in three
major forms 1. dissolved (a little) 2. as
bicarbonate and H (a lot) 3. attached to
hemoglobin as a carbamino compound.
Loading of CO2 from tissue to blood and
associated O2 release from blood to tissue.
28
29
Anatomy of the Heart
29
30
BLooD FloW through the HeaRt
Establishment of the four-chambered heart, along
with the pulmonary and systemic circuits,
completely separates oxygenated from deoxygenated
blood. Fig8.9, p. 201
30
31
Valves direct Blood Flow
31
32
Blood Flow to the Body
32
33
Blood Flow to the Body
33
34
34
35
Blood Vessels and Flow Changes
35A
36
The Heart MUSCLE
Myocardium
Intercalated Discs connect the individual fibers
of muscle to act as ONE BIG FIBER Functional
Syncytium When one fiber contracts- all fibers
contract
35
37
Conduction System SA node
36
SA node
PACEMAKER
38
Conduction System AV Node
37
AV node
Bundle of His
PURKINJI FIBERS
39
Electrical System in Review
38
40
Blood Supply to the Heart
39
41
Blood Supply to the Heart
Coronary Vessels
Coronary Arteries Coronary Veins
40
40
42
Coronary vessels branch from Aorta L Coronary
Artery R Coronary Artery
41
43
Blood Supply to the Heart
Coronary Veins Coronary Sinus Right
Atrium
42
44
CARDIAC OUTPUT
. Q
CARDIAC OUTPUT
SV (ML/BEAT) x HR (BEATS/MIN)
L/min
2 Components STROKE VOLUME (SV) HEART RATE (HR)
43
45
CARDIAC OUTPUT
Cardiac Output increases for Endurance Athletes
44
46
HEART RATE EXERCISE
HEART RATE
SUBMAX EXERCISE
Max EXERCISE
REST
45
47
Exercise Blood Flow
Vasoconstriction of Arterioles to Inactive
Organs Vasodilation of Arterioles to
ActiveMuscles
46
48
O2 Transport and Endurance
- The arterial- mixed venous difference (a- v O2
diff) - Affected by
- the Amt. Of O2 extracted by muscles
- overall distribution of blood flow
- O2 extracted-- a-v O2 diff --
- ENDURANCE
- since less O2 in venous blood
47
49
O2 Transport and Endurance
Performance is affected by 1. VO2 max max O2
consumption 2. Anerobic Threshold of
VO2 max utilized in relation to Lactic acid
production 3. Degree of Efficiency
48
50
O2 Transport and Endurance
Lactic Acid Accumulation begins only after a
certain VO2 max is reached- this starting
point is ANAEROBIC THRESHOLD VO2 used / VO2
max x 100 VO2 max
49
51
O2 Transport and Endurance
Efficiency of O2 Transport System Amt of O2
Required during a given Exercise level If you
require less of your VO2 max you will be less
fatigued and able to run faster or farther MORE
EFFICIENT
50
52
O2 Transport Acclimatization
Acclimatization the process of adapting
performance levels to a higher Altitude
Physiological Changes Hyperventilation Increased
Hemoglobin Concentration
51
Recommended
CrystalGraphics Presentations


