
Confidence intervals for the mean - continued - PowerPoint PPT Presentation
1 / 20
Title:
Confidence intervals for the mean - continued
Description:
Confidence intervals for the mean - continued Population Mean - Sample mean: X Reminder Point estimator for : Limitations of point estimators Interval estimation ... – PowerPoint PPT presentation
Number of Views:63
Avg rating:3.0/5.0
Title: Confidence intervals for the mean - continued
1
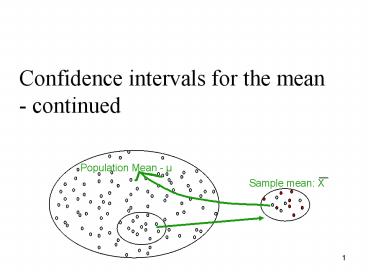
Confidence intervals for the mean - continued
Population Mean - µ
Sample mean X
2
Reminder
- Point estimator for µ
- Limitations of point estimators
- Interval estimation for µ
3
A (1-a) confidence interval for µ
- A (1-a) confidence interval for µ is
(1-a)
a/2
a/2
Z 1-a/2
Z a/2
4
Example
- A test for the level of potassium in the blood
is not perfectly precise. Moreover, the actual
level of potassium in a persons blood varies
slightly from day to day. Suppose that repeated
measurements for the same person on different
days vary normally with s0.2.
5
- (a) Julies potassium level is measured three
times and the mean result is .
Give a 90 confidence interval for Julies mean
blood potassium level.
90 confidence interval for
3.21,3.59
6
- (b) A confidence interval of 95 level would be
- (i) wider than a confidence interval of 90
level - (ii) narrower than a confidence interval of 90
level - (c) Give a 95 confidence interval for Julies
mean blood - potassium level.
95 confidence interval for
3.174,3.626
7
- (d) Julie wants a 99 confidence interval of
3.3,3.5. What sample size should she take to
achieve this (how many times should she measure
her potassium blood level?) - 3.3,3.53.4Z0.995(0.2/vn)
- 3.4-Z0.995(0.2/vn)3.3
- 3.4Z0.995(0.2/vn)3.5
- solve for n
- subtract the first equation from the second ?
2Z0.995(0.2/vn)0. 2 - Z0.995(0.2/vn)0.1
- 2.575(0.2/vn)0.1
- (0.2/vn)0.0388
- vn5.15
- ? n26.5225
- she needs 27 blood tests to achieve a 99 CI
3.3,3.5.
8
Finding n for a specified confidence interval
Suppose we want a specific interval with a
confidence level 1-a. What sample size should be
taken to obtain this CI? Define m the distance
from the mean to the upper/lower limit of the CI
For the blood potassium example m3.5-3.40.1
(3.3-3.40.1)
9
Example
- An agricultural researcher plants 25 plots with
a new variety of corn. The average yield for
these plots is 150 bushels per Acre.
Assume that the yield per acre for the new
variety of corn follows a normal distribution
with unknown µ and standard deviation s10
bushels per acre. A 90 confidence interval for µ
is - (a) 1502.00
- (b) 1503.29
- (c) 1503.92
- (d) 15032.9
10
- An agricultural researcher plants 25 plots with
a new variety of corn. The average yield for
these plots is 150 bushels per Acre.
Assume that the yield per acre for the new
variety of corn follows a normal distribution
with unknown µ and standard deviation s10
bushels per acre. Which of the following will
produce a narrower confidence interval than the
90 confidence interval that you computed above? - (a) Plant only 5 plots rather than 25
- (b) Plant 100 plots rather than 25
- (c) Compute a 99 confidence interval rather than
a 90 confidence interval. - (d) None of the above
11
Example
- You measure the weight of a random sample of 25
male runners. The sample mean is 60
kilograms (kg). Suppose that the weights of male
runners follow a normal distribution with unknown
mean µ and standard deviation s5 kg. A 95
confidence interval for µ is - (a) 59.61,60.39
- (b) 59,61
- (c) 58.04,61.96
- (d) 50.02,69.8
12
- You measure the weight of a random sample of 25
male runners. The sample mean is 60
kilograms (kg). Suppose that the weights of male
runners follow a normal distribution with unknown
mean µ and standard deviation s5 kg. Supposed I
had measured the weights of a random sample of
100 runners rather than 25 runners. Which of the
following statements is true? - (a) The lengths of the confidence interval would
increase - (b) The lengths of the confidence interval would
decrease - (c) The lengths of the confidence interval would
stay the same - (d) s would decrease
13
Example
- Suppose we wanted a 90 confidence interval of
length 4 for the average amount spent on books
by freshmen in their first year at a major
university. The amount spent has a normal
distribution with s30. - The number of observations required is closest
to - 25
- 30
- 609
- 865
14
- mhalf of the CI length (marginal error)
- m
- a
4/22
0.1
15
Example
- You plan to construct a confidence interval for
the mean µ of a normal population with known
standard deviation s. Which of the following will
reduce the size of the confidence interval? - use a lower level of confidence
- Increase the sample size
- Reduce s
- All the above
16
Example
- A 95 confidence interval for the mean µ of a
population is computed from a random sample and
found to be 93. We may conclude that - (a) There is a 95 probability that µ is between
6 and 12 - (b) There is a 95 probability that the true mean
is 9 and there is a 95 probability that the true
mean is 3 - (c) If we took many additional random samples and
from each computed a 95 confidence interval for
µ, approximately 95 of these intervals would
contain µ. - (d) All of the above
17
Example
- The heights of young American women, in inches,
are normally distributed with mean µ and standard
deviation s2.4. I select a simple random sample
of four young American women and measure their
heights. The four heights, in inches, are - 63 69 62 66
- Based on these data, a 99 confidence interval
for µ, in inches, is - (a) 651.55
- (b) 652.35
- (c) 653.09
- (d) 654.07
18
- Mean of four heights
- CI
- CI61.91,68.09
19
- The heights of young American women, in inches,
are normally distributed with mean µ and standard
deviation s2.4. I select a simple random sample
of four young American women and measure their
heights. The four heights, in inches, are - 63 69 62 66
- If I wanted the 99 confidence interval to be
1 inch from the mean, I should select a simple
random sample of size - 2
- 7
- 16
- 39
20
- mhalf of the CI length (marginal error)
- m
- a
1
0.01
Recommended
CrystalGraphics Presentations


