
Table 222 Page 493 - PowerPoint PPT Presentation
1 / 21
Title:
Table 222 Page 493
Description:
MICHIGAN. MICHIGAN. Nipigon Bay. Thunder Bay. Silver Bay. St. Louis R. Jackfish Bay. St. Mary's R. ... Sprinkle nanoparticles over an oil or sewage spill to ... – PowerPoint PPT presentation
Number of Views:74
Avg rating:3.0/5.0
Title: Table 222 Page 493
1
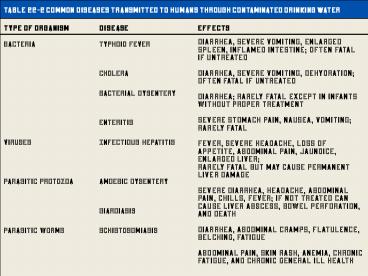
Table 22-2Page 493
Table 22-2 Common Diseases Transmitted to Humans
Through Contaminated Drinking Water
Type of Organism Bacteria Viruses Par
asitic protozoa Parasitic worms
Disease Typhoid fever Cholera Bacterial
dysentery Enteritis Infectious
hepatitis Amoebic dysentery Giardiasis Schis
tosomiasis
Effects Diarrhea, severe vomiting, enlarged
spleen, inflamed intestine often fatal if
untreated Diarrhea, severe vomiting,
dehydration often fatal if untreated Diarrhea
rarely fatal except in infants without proper
treatment Severe stomach pain, nausea, vomiting
rarely fatal Fever, severe headache, loss of
appetite, abdominal pain, jaundice, enlarged
liver rarely fatal but may cause permanent liver
damage Severe diarrhea, headache, abdominal
pain, chills, fever if not treated can cause
liver abscess, bowel perforation, and
death Diarrhea, abdominal cramps, flatulence,
belching, fatigue Abdominal pain, skin rash,
anemia, chronic fatigue, and chronic general ill
health
2
Figure 22-2Page 493
3
Figure 22-3Page 494
Water Quality
DO (ppm) at 20C
Good
8-9
Slightly polluted
6.7-8
Moderately polluted
4.5-6.7
Heavily polluted
Below 4.5
Gravely polluted
Below 4
4
Figure 22-4Page 494
5
Normal clean water organisms (trout, perch,
bass, mayfly, stonefly)
Trash fish (carp, gar, leeches)
Fish absent, fungi, sludge worms, bacteria (anaero
bic)
Trash fish (carp, gar, leeches)
Normal clean water organisms (trout, perch,
bass, mayfly, stonefly)
8 ppm
Types of organisms
8 ppm
Dissolved oxygen (ppm)
Biological oxygen demand
Clean Zone
Recovery Zone
Septic Zone
Decomposition Zone
Clean Zone
Figure 22-5Page 496
6
Animation
Stream pollution animation.
Click to view animation.
7
Figure 22-6Page 498
8
Nitrogen compounds produced by cars and factories
Discharge of untreated municipal sewage (nitrates
and phosphates)
Discharge of detergents ( phosphates)
Inorganic fertilizer runoff (nitrates and
phosphates)
Manure runoff from feedlots (nitrates,
phosphates, ammonia)
Discharge of treated municipal sewage (primary
and secondary treatment nitrates and phosphates)
Runoff from streets, lawns, and construction lots
(nitrates and phosphates)
Lake ecosystem nutrient overload and breakdown
of chemical cycling
Runoff and erosion (from cultivation, mining,
construction, and poor land use)
Dissolving of nitrogen oxides (from internal
combustion engines and furnaces)
Figure 22-7Page 499
9
Figure 22-8Page 500
CANADA
Nipigon Bay
Jackfish Bay
Thunder Bay
Silver Bay
St. Marys R.
St. Lawrence R.
Spanish R.
St. Louis R.
MICHIGAN
Penetary Bay
WISCONSIN
Sturgeon Bay
MICHIGAN
Saginaw Bay
NEW YORK
Niagara Falls
Saginaw R. System
Grand R.
MINNESOTA
Niagara R.
St. Clair R.
Thames R.
Buffalo R.
Detroit R. Rouge R. Raisin R.
Ashtabula R.
PENNSYLVANIA
IOWA
Cuyahoga R.
Maumee R.
Rocky R.
Black R.
ILLINOIS
INDIANA
OHIO
Great Lakes drainage basin
Most polluted areas, according to the Great Lakes
Water Quality Board
Hot spots of toxic concentrations in water and
sediments
Eutrophic areas
10
Polluted air
Figure 22-9Page 502
11
Solutions
Groundwater Pollution
Prevention
Cleanup
Find substitutes for toxic chemicals
Pump to surface, clean, and return to aquifer
(very expensive)
Keep toxic chemicals out of the environment
Install monitoring wells near landfills and
underground tanks
Inject microorganisms to clean up contamination
(less expensive but still costly)
Require leak detectors on underground tanks
Ban hazardous waste disposal in landfills and
injection wells
Pump nanoparticles of inorganic compounds to
remove pollutants (may be the cheapest, easiest,
and most effective method but is still being
developed)
Store harmful liquids in aboveground tanks with
leak detection and collection systems
Figure 22-10Page 503
12
Figure 22-11Page 504
Industry Nitrogen oxides from autos and
smokestacks toxic chemicals, and heavy metals in
effluents flow into bays and estuaries.
Cities Toxic metals and oil from streets
and parking lots pollute waters sewage adds
nitrogen and phosphorus.
Urban sprawl Bacteria and viruses from sewers and
septic tanks contaminate shellfish beds and
close beaches runoff of fertilization from lawns
adds nitrogen and phosphorus.
Construction sites Sediments are washed into
waterways, choking fish and plants,
clouding waters, and blocking sunlight.
Farms Run off of pesticides, manure,
and fertilizers adds toxins and excess nitrogen
and phosphorus.
Red tides Excess nitrogen causes explosive growth
of toxic microscopic algae, poisoning fish and
marine mammals.
Closed shellfish beds
Closed beach
Oxygen-depleted zone
Toxic sediments Chemicals and toxic
metals contaminate shellfish beds, kill spawning
fish, and accumulate in the tissues of bottom
feeders.
Healthy zone Clear, oxygen-rich waters promote
growth of plankton and sea grasses, and support
fish.
Oxygen-depleted zone Sedimentation and
algae overgrowth reduce sunlight, kill beneficial
sea grasses, use up oxygen, and degrade habitat.
13
Figure 22-12Page 505
Mississippi River Basin
Ohio River
Missouri River
Mississippi River
LOUISIANA
Mississippi River
Depleted
Oxygen
Gulf of Mexico
14
Figure 22-13Page 506
Cooperstown
NEW YORK
PENNSYLVANIA
ATLANTIC OCEAN
Harrisburg
NEW JERSEY
MARYLAND
Baltimore
Washington
WEST VIRGINIA
DELAWARE
Richmond
VIRGINIA
Chesapeake Bay
Norfolk
Drainage basin
No oxygen
Low concentrations of oxygen
15
Solutions
Coastal Water Pollution
Prevention
Cleanup
Reduce input of toxic pollutants
Improve oil-spill cleanup capabilities
Separate sewage and storm lines
Ban dumping of wastes and sewage by maritime and
cruise ships in coastal waters
Sprinkle nanoparticles over an oil or sewage
spill to dissolve the oil or sewage without
creating harmful byproducts (still under
development)
Ban ocean dumping of sludge and hazardous dredged
material
Protect sensitive areas from development, oil
drilling, and oil shipping
Require at least secondary treatment of coastal
sewage
Regulate coastal development
Use wetlands, solar-aquatic, or other methods to
treat sewage
Recycle used oil
Require double hulls for oil tankers
Figure 22-14Page 508
16
Septic tank with manhole (for cleanout)
Household wastewater
Nonperforated pipe
Distribution box (optional)
Gravel or crushed stone
Drain field
Vent pipe
Figure 22-15Page 510
Perforated pipe
17
Figure 22-16Page 511
Secondary
Primary
Grit chamber
Chlorine disinfection tank
Bar screen
Settling tank
Aeration tank
Settling tank
To river, lake, or ocean
Raw sewage from sewers
(kills bacteria)
Sludge
Activated sludge
Air pump
Sludge digester
Sludge drying bed
Disposed of in landfill or ocean or applied to
cropland, pasture, or rangeland
18
Odors Odors may cause illness or indicate
presence of harmful gases
Dust Particles Particles of dried sludge carry
viruses and harmful bacteria that can be inhaled,
infect cuts or enter homes.
Exposure Children may walk or play in fertilized
fields.
BUFFER ZONE
Livestock Poisoning Cows may die after grazing on
sludge-treated fields.
Sludge
Groundwater Contamination Harmful chemicals and
pathogens may leach into groundwater and shallow
wells.
Surface Runoff Harmful chemicals and pathogens
may pollute nearby streams, lakes, ponds, and
wetlands.
Figure 22-17Page 512
19
Figure 22-18Page 513
(1) Raw sewage drains by gravity into the
first pool and flows through a long
perforated PVC pipe into a bed of limestone
gravel.
(3) Wastewater flows through another
perforated pipe into a second pool, where
the same process is repeated.
Sewage
Treated water
Wetland type plants
Wetland type plants
45 centimeter layer of limestone gravel coated
with decomposing bacteria
First concrete pool
Second concrete pool
(2) Microbes in the limestone gravel break
down the sewage into chemicals that can be
absorbed by the plant roots, and the gravel
absorbs phosphorus.
(4) Treated water flowing from the second
pool is nearly free of bacteria and plant
nutrients. Treated water can be recycled
for irrigation and flushing toilets.
20
Solutions
Water Pollution
- Prevent groundwater contamination
- Greatly reduce nonpoint runoff
- Reuse treated wastewater for irrigation
- Find substitutes for toxic pollutants
- Work with nature to treat sewage
- Practice four R's of resource use (refuse,
reduce, recycle, reuse) - Reduce resource waste
- Reduce air pollution
- Reduce poverty
- Reduce birth rates
Figure 22-19Page 516
21
What Can You Do?
Water Pollution
- Fertilize your garden and yard plants with manure
or compost instead of commercial inorganic
fertilizer. - Minimize your use of pesticides.
- Never apply fertilizer or pesticides near a body
of water. - Grow or buy organic foods.
- Compost your food wastes.
- Do not use water fresheners in toilets.
- Do not flush unwanted medicines down the toilet.
- Do not pour pesticides, paints, solvents, oil,
antifreeze, or other products containing harmful
chemicals down the drain or onto the ground.
Figure 22-20Page 516