
Surface Alloy Composition Determination with Nanometer Resolution - PowerPoint PPT Presentation
1 / 31
Title:
Surface Alloy Composition Determination with Nanometer Resolution
Description:
APS Los Angeles, March 21, 2005 ... APS Los Angeles, March 21, 2005. An example: LEED movie for Si(111) at various electron energies ... – PowerPoint PPT presentation
Number of Views:110
Avg rating:3.0/5.0
Title: Surface Alloy Composition Determination with Nanometer Resolution
1
Surface Alloy Composition Determination with
Nanometer Resolution
Jiebing Sun Physics Department and Material
Science Program University of New
Hampshire 10/06/2005
2
Ultra-thin film alloy
- Novel electronic / catalytic / magnetic
properties - Inhibiting electromigration
- Physical basis structure and composition
- Critical technologies to control structure and
composition - Subsurface chemical sensitivity
- Nanometer resolution of inhomogeneous structure
---- LEED (Low Energy Electron Diffraction)
---- LEEM (Low Energy Electron Microscopy)
STM, AFM ?
3
CanLEEM do LEED ?
To be answered in this talk
4
Outline
- ?. Computer simulation of LEED IV curves (IV
Intensity vs Voltage) - ??. LEED IV curves by LEEM imaging technique
- ???. Study on the Pd/Cu(001) alloy system
5
- Part ?
- Computer simulation of LEED IV curves
6
Low energy electron as a probe of surface
The mean free part of the electrons in solid. The
dots are measurements while the dashed curve is a
calculation. After Zangwills book and references
therein.
- Electron mean-free-path ? 10 Å, surface
sensitive - Wavelength Å, comparable
to lattice constants when E10 350 eV.
7
2D direct lattice and reciprocal lattice
A rectangular lattice
Real space
- 5 possible 2D Bravais lattice and reciprocal
lattice - Lattice vector in the reciprocal space
Reciprocal space
Miller index
Note The reciprocal lattice has the SAME
symmetry as the direct lattice.
8
Elastic diffraction Condition
Indices of reciprocal rods
- Kinematic electron scattering by
symmetry-breaking surface - Elastic diffraction
- Laue equations (Bragg condition)
- interlayer spacing
- Establishment of Ewald sphere
Ewald sphere construction for LEED
9
Information obtained from LEED
- Qualitatively from diffraction pattern
- - Well-ordered surface structure
- - Real space lattice point location
- Quantitatively from IV curves beam intensity vs
electron energy - - Reconstruction
- - Relaxation
- - Atomic arrangement in the unit cell
- - Thermal vibration information
- - Composition for alloy
10
Conventional LEED set-up
Pattern
IV curve
LEED optics
LEED set up
http//www.uam.es/departamentos/ciencias/fismateri
ac/especifica/lasuam/danyela/leed.html
11
An example LEED movie for Si(111) at various
electron energies
Pattern shrinks as e-beam energy increases.
http//www.ocivm.com/movie.htm
12
H. Mönig, J. Sun et al. Phys. Rev. B 72, 085410
(2005)
An example LEED I-V curves for surface Bi(111)
13
Multiple scattering theory
- Complicated by multiple scattering from ion core
- Dynamic calculation is needed against kinematic
analysis in X-ray diffraction - 4 essential ingredients in the dynamical process
- - ion-core scattering muffin-tin potential
- - intra- and interlayer diffraction multiple
scattering - - inelastic scattering the damping potential
- - temperature effects Debye-waller factor
14
Surface structure optimization
- Comparing experimental and calculated intensities
with different trial model structures - Reliability (R) factor to measure the agreement
- - RP Pendry R factor
- - R2 similar to ?2 used in X-ray
diffraction - Best-fit structure is considered as the true
structure - Parameters typically optimized
- - Interlayer spacing at the surface
- - Root-mean-square of surface atomic
vibrational amplitude - - Lateral displacement parallel to the
surface plane - - Real part and imaginary part of Inner
potential - - Compositional distribution for surface
alloy
15
Implementation of LEED theory in computation
codes1
Phase shifts calculations
Atomic t-matrix
Intralayer scattering matrix
e?
Side View
1 David Adams, University of Aarhus, Denmark
16
- Part ??
- LEED IV curves by LEEM imaging technique
17
LEEM set-up
ONLY about 20 LEEM facilities in the world
aperture
The IBM LEEM II system designed by R. Tromp.
18
Differences of LEEM from conventional LEED set-up
- LEEM imaging real space
- (LEED pattern is reciprocal space.)
- Imaging by one beam (00) beam
- (Many spots in LEED pattern.)
- Lower beam energy 5 100 eV
- (10 350 eV in LEED.)
- High spatial resolution 8.5 nm
- (In the order of ?m in conventional LEED.)
Question Does LEEM work?
19
LEEM image and IV curve from any point of image
Step
Island
Beam energy (eV)
Surface reflectivity changing with e-beam kinetic
energy
20
Part ??? Study on the Pd/Cu(001) alloy system
21
Why Pd/Cu(001) alloy system?
- Basics are well understood.
- Pd is an electromigration inhibitor.
- Good model alloy for generic thin-film growth
mechanism study - Unstable checkerboard structure at R. T.
Side view
Cu(001)-c(2x2)-Pd structure at room temperature
22
Investigations over area of interest
- Clean Cu(001)
- Temporal resolution terrace of the alloy
- Spatial resolution line scan across the step
- 3D resolution circular area containing step
Monatomic step
23
Clean Cu(001)
Energy-dependent inner potential V0 iVim
1 J. Rundgren. Phys. Rev. B, 595106, 1999.
2 H. L. Davis and J. R. Noonan. J. Vac. Sci.
Technol., 20842, 1982.
24
Cu(001)-c(2?2)-Pd alloy
Top view
- Each of the first 3 topmost layer divided into
two c(2?2) sublattices - Compositional parameters optimized c11, c12,
c21, c22, c31, c32 for the Cu concentration in
each sublattice. - Pd concentration for each layer are calculated
ci 1-(ci1ci2)/2 (i1,3) - Average t-matrix approximation (ATA) is used to
calculate t-matrix element 1.
Sublattice 1
Sublattice 2
1 J. Korringa, J. Phys. Chem. Solids, 7,
252(1958)
25
Time resolution terrace of the alloy
- Simpler analysis because intensity far from steps
is spatially uniform. - Deposition at 200 C, record IV curves at
different times.
26
Spatial resolution line scan across the step
- At each point along a line in the image,
construct an IV curve of the (00) beam - Analyze each IV curve to determine local
concentration ( 8.5 nm spatial resolution)
X 0
nm
X 1230 nm
Gray curve IV on the terrace far from the step
The main changes are the peak intensities at 13
and 20 eV.
27
Line scan analysis supports a simple overgrowth
model
- Make line scan at different times
- 3rd layer is immobile
- Step overgrowth converts 2nd to 3rd
step flow
t1 lt t2 lt t3
28
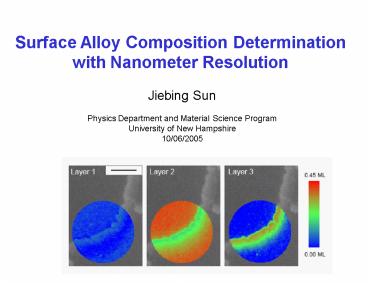
3D resolution circular area containing step
t 27 min
Scale bar 500 nm. Resolution 8.5 nm. 17,655
pixels. 30 days on 5 computers.
29
Summary and conclusions
- The first time to measure the 3D compositional
inhomogeneity in the surface alloy by employing
LEEM to do LEED. - The first time to establish step-induced
overgrowth model with good temporal ( 3 min) and
high spatial ( 8.5 nm) resolution.
W o r k s !
30
My next work
31
Acknowledgement
Working with Karsten Pohl (UNH Surface
Group) James B. Hannon (IBM T. J. Watson Research
Center, Yorktown Heights, NY) Gary L. Kellogg
(Sandia Natl Laboratories, Albuquerque, NM)
- Help from
- Matti Lindroos (Tampere University of Technology,
Finland) - Anders Mikkelsen (Lund University, Sweden)
- Bogdan Diaconescu, Georgi Nenchv, Seth Quarrier,
Brian Patenaude (UNH Surface Group) - Michael Briggs (Physics Department, UNH)
Recommended
CrystalGraphics Presentations


