
deceased - PowerPoint PPT Presentation
1 / 10
Title:
deceased
Description:
... sexually transmitted disease (STD) during the 1998-2003 time frame are ... Reported HIV Infection Among Persons Reported with any STD: (1,269/119,210)=1.1 ... – PowerPoint PPT presentation
Number of Views:52
Avg rating:3.0/5.0
Title: deceased
1
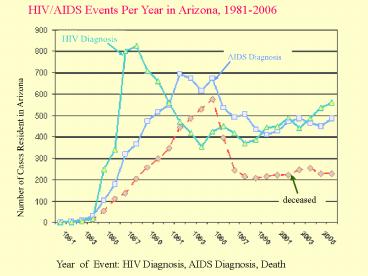
HIV/AIDS Events Per Year in Arizona, 1981-2006
HIV Diagnosis
AIDS Diagnosis
Number of Cases Resident in Arizona
deceased
Year of Event HIV Diagnosis, AIDS Diagnosis,
Death
2
Emergent HIV/AIDS Diagnoses in Arizona 1999-2006
3
Prevalence Current Estimated HIV/AIDS Rate, by
County
State Prevalence Rate 206
a- Pima b- Maricopa c- Pinal d- La Paz e-
Coconino f- Cochise g- Mohave h- Graham i-
Yavapai j-Ste Cruz k- Yuma l- Gila m- Navajo n-
Apache o- Greenlee 30-50 of prevalent
cases in Pinal and Graham counties are
among incarcerated persons.
Rate Per 100,000
4
Incidence Mean Annual Emergent HIV/AIDS Rate,
2001-2005, by County
- a- Pinal
- b- Maricopa
- c- Pima
- d- Coconino
- e- Navajo
- f- Apache
- g- Graham
- h- La Paz
- i- Cochise
- j- Mohave
- k- Yavapai
- l- Yuma
- m- Ste Cruz
- n- Gila
- o- Greenlee
- 60 of emergent
- cases in Pinal and
- Graham counties
- during 1999-2003
State Incidence Rate 13.3
Rate Per 100,000
5
Phoenix EMA Emergent HIV/AIDS by Gender 1999-2006
Rate per 100,000
6
Relative Percentage of Emergent Cases by Reported
Risk Behavior in Arizona 1981-2006
7
Relative Percentage of Emergent Cases by Race in
Arizona 1981-2006
Excludes Ethnic Hispanics
A/PI Asian/Pacific Islander AI/ANAmerican
Indian /Alaska Native
8
Arizona 5-Year Emergent HIV/AIDS Rate by
Race/Ethnicity 1990-2005
Rate Per 100,000 Persons
Excludes Ethnic Hispanics
A/PI Asian/Pacific Islander AI/ANAmerican
Indian /Alaska Native
9
Arizona Percent/Rate Currently Infected with HIV
Among Estimated Risk Group Population
10
Lifetime Co-morbidity Pattern Among Persons
Diagnosed with HIV/AIDS, Hepatitis C, or a
Sexually Transmitted Disease Arizona 1998 - 2003
1,722
Hepatitis C
43,344
Sexually Transmitted Diseases
116,219
1,272
HIV/AIDS
Total HIV/AIDS 17,191 Total Hepatitis C
46,509 Total STDs 119,210
14,650
171
1,098
- A total of 178,476 persons reported in Arizona
with any diagnosis of HIV/AIDS, Hepatitis C, or a
sexually transmitted disease (STD) during the
1998-2003 time frame are included in this
analysis. A lifetime diagnostic history of HIV,
AIDS, Hepatitis C or an STD was constructed for
persons in this analysis using all available
data. The Venn diagram presents the lifetime
co-morbidity configuration for this group of
persons. Current reported HIV infection in
Arizona is nearly 0.2. Using this figure, the
likelihood of HIV infection with a diagnosis of
Hepatitis C are 15.5 times (3.1/0.2) greater,
and a with a diagnosis of an STD are 5.5 times
(1.1/0.2) greater than in the general
population of Arizona.
Reported HIV Infection Among Persons Reported
with HepC (1,443/46,509) 3.1 Reported HIV
Infection Among Persons Reported with any
STD (1,269/119,210)1.1
Recommended
CrystalGraphics Presentations


