
ASTER - PowerPoint PPT Presentation
1 / 31
Title: ASTER
1
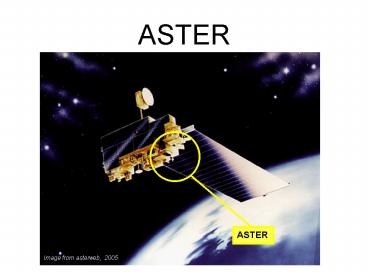
ASTER
ASTER
Image from asterweb, 2005
2
Terra
- Orbit Terra has a 705 km altitude that is
sun-synchronous (at a given latitude it crosses
directly overhead at the same time each day) - Orbit period 98.88 minutes
- Equator crossing 10.30 a.m. (north to south)
- Ground track repeat cycle Every 16 days (233
orbits) the pattern of orbits repeats itself - Builder Lockheed Martin
3
Terra
- Terra is part of the NASAs Earth Observing
System. - Spacecraft in this system observe Earth from the
unique vantage point of space. - Spacecraft in the system focus on key
measurements identified by a consensus of U.S.
and international scientists, enabling new
research into the ways Earths land, oceans, air,
ice and life function as a total environmental
system. - Launched into orbit on December 18, 1999, Terra
started sending data back to earth in February
2000. - Orbit 705 km
- Orbit period 98.88 minutes
- Equator crossing 10.30 a.m. (north to south)
- Ground track repeat cycle Every 16 days (233
orbits) the pattern of orbits repeats itself - In addition to ASTER, Terra carries four
additional scientific instruments CERES, MISR,
MODIS, and MOPITT.
4
What is ASTER(R)?
- ASTER is situated on the Terra spacecraft.
- ASTER is an acronym for Advanced Spaceborne
Thermal Emission and Reflection Radiometer - ASTER is a remote sensing device used to obtain
detailed maps of land surface temperature,
reflectance, and elevation. - ASTER provides the next generation in remote
sensing imaging capabilities compared to older
sensing systems such as the Landsat Thematic
Mapper and Japan's JERS-1 OPS scanner.
5
What is ASTER?
- ASTER is a cooperative effort between NASA,
Japan's Ministry of Economy, Trade and Industry
(METI), and Japan's Earth Remote Sensing Data
Analysis Center (ERSDAC). - ASTER captures high spatial resolution data in 14
bands, from the visible to the thermal infrared
wavelengths and provides stereo viewing
capability for digital elevation model creation. - As the "zoom lens" for Terra, ASTER data are used
by other Terra and space-borne instruments for
validation and calibration.
6
Data Application
- land surface climatology -- investigation of
land surface parameters, surface temperature,
etc., to understand land-surface interaction and
energy and moisture fluxes - vegetation and ecosystem dynamics --
investigations of vegetation and soil
distribution and their changes to estimate
biological productivity, understand
land-atmosphere interactions, and detect
ecosystem change - volcano monitoring -- monitoring of eruptions
and precursor events, such as gas emissions,
eruption plumes, development of lava lakes,
eruptive history and eruptive potential - hazard monitoring -- observation of the extent
and effects of wildfires, flooding, coastal
erosion, earthquake damage, and tsunami damage
7
Mount St. Helens
- Captured one week after the March 8 ash and steam
eruption - New lava dome in the southeast part of the crater
is clearly visible, highlighted by red areas
where ASTERs infrared channels detected hot
spots from incandescent lava. - In this band combination, vegetation is green,
snow is light blue, and bare rocks are tan. - This image combines visible and infrared bands.
Image from asterweb, 2005
8
Eruption of Mt. Etna, Italy
Image from asterweb, 2005
9
New Orleans after Hurricane Katrina
- Top image ASTER mosaic acquired in April and
September 2000. - Bottom image ASTER image acquired September 13,
2005. - The flooded parts of the city appear dark blue,
such as the golf course in the northeast corner,
where there is standing water. - Areas that have dried out appear light blue gray,
such as the city park in the left middle. - On the left side of the image, the failed 17th
street canal marks a sharp boundary between
flooded city to the east, and dry land to the
west.
Image from asterweb, 2005
10
Banda Aceh, Indonesia after tsunami
Image from asterweb, 2005
11
Data Application
- hydrology -- understanding global energy and
hydrologic processes and their relationship to
global change included is evapotranspiration
from plants - geology and soils -- the detailed composition
and geomorphologic mapping of surface soils and
bedrocks to study land surface processes and
earth's history - land surface and land cover change -- monitoring
desertification, deforestation, urbanization
providing data for conservation managers to
monitor protected areas, national parks,
wilderness areas. - mineral exploration -- bands in the 2.3 micron
region for improved mineral mapping and
discrimination between individual minerals
12
Mineral Exploration
- Distinguishing clay minerals by different
absorption features - Standard USGS reference spectra for Na-Sericite,
K-sericite, phengite and Mg/Fe phengite showing
the progress shift of the absorption band
position to longer wavelengths (top) and the same
spectra convolved to the ASTER band configuration
showing the variation in the shape of the 2209nm
absorption band for the same minerals (bottom).
from www.rsinc.com, 2005
13
The Moon
- In mid-April, the Terra spacecraft was turned
upside down and pointed at the Moon. - This ASTER image was acquired at that time,
showing band 3 visible in black and white. - This maneuver was performed to provide a
well-characterized radiometric and geometric
target to the Terra instruments to help refine
performance.
Image from asterweb, 2005
14
Mineral Exploartion in Nevada with Visible-Near
IR
Image from asterweb, 2005
15
Sensor Popularity
- Growing popularity
- Relatively Low Cost e.g. 99 for a single scene
data from the USGS. - Broad Area Coverage
- Provides 3 Times the Spectral Information
provided in Landsat images
16
ASTER location on the Terra Spacecraft
Image from asterweb, 2005
17
ASTER Components
- ASTER is comprised of three separate instrument
subsystems. - Each ASTER subsystem
- operates in a different spectral region
- has its own telescope(s)
- was manufactured by a different Japanese company
Image from asterweb, 2005
18
VNIR
- The VNIR subsystem operates in three spectral
bands at visible and near-IR wavelengths - It consists of two telescopes--one nadir-looking
with a three-spectral-band detector, and the
other backward-looking with a single-band
detector. - It has a resolution of 15 m
- The backward-looking telescope provides a second
view of the target area in Band 3 for stereo
observations.
19
VNIR
- Cross-track pointing to 24 degrees on either side
of the track is accomplished by rotating the
entire telescope assembly. - Band separation is through a combination dichroic
elements and interference filters that allow all
three bands to view the same ground area
simultaneously. - The VNIR subsystem produces by far the highest
data rate of the three ASTER imaging subsystems
with all four bands operating (3 nadir and 1
backward) the data rate can reach up to 62 Mbps.
20
VNIR Component
Backward Looking Telescope
Nadir Looking Telescope
Image from asterweb, 2005
21
SWIR
- The SWIR subsystem operates in six spectral bands
in the near-IR region - It uses a single, nadir-pointing telescope
- It has a resolution of 30 m
- Cross-track pointing can be accomplished by a
pointing mirror. - The maximum data rate is 23 Mbps.
22
SWIR Component
Pointing Mirror
Telescope
Cryocooler
Image from asterweb, 2005
23
TIR
- The TIR subsystem operates in five spectral bands
in the thermal infrared region. - It uses a single, fixed-position, nadir-looking
telescope. - It has a resolution of 90 m.
- Unlike the other ASTER instrument subsystems, the
TIR mirror functions both for scaning along-track
(push broom) or cross-track pointing. - Each band uses 10 detectors in a staggered array
with optical bandpass filters over each detector
element. - The maximum data rate is 4.2 Mbps.
24
TIR Component
Scanning Mirror
Telescope
Reference Plate (for calibration purposes)
Cryocooler
Image from asterweb, 2005
25
from Keller presentation, 2005
26
ASTER Instrument Characteristics
from asterweb, 2005
27
Visible-NIR
Visible-NIR
Thermal IR
Short Wave IR
Image from asterweb, 2005
28
Comparison with other RS instruments
2048 km swath
AVHRR/ MODIS
global coverage, 2 days
spatial resolution, 250m, 500m, 1000m
On the Terra spacecraft.
MISR
global coverage, 9 days
360 km
spatial resolution, 275m, 550m, 1100m
16 day orbital repeat
Landsat
185 km
seasonal global coverage
spatial resolution, 15m, 30m
ASTER
60 km
spatial resolution 15m, 30m, 90m
Commercial Systems
20 km
spatial resolution 1m, 5m
from Keller presentation, 2005
29
Image from PACES website, 2005
30
Browse Image Mosaic
925,661 scenes observed as February 9th, 2005
Image from asterweb, 2005
31
References
- Keller, G.R., 2005, Remote Sensing course
presentation - PACES website
- http//paces.geo.utep.edu
- Jet Propulsion Laboratory website (ASTER
section) - http//asterweb.jpl.nasa.gov/eos.asp
- Department of Industry,Tourism and Resources
(Australia) Geoscience Australia
http//www.ga.gov.au/ausgeonews/ausgeonews200503/p
roductnews.jsp - RSI website (ENVI section)
- http//www.rsinc.com/Envi/envi_app_aster.asp