
1994 Northridge Earthquake - PowerPoint PPT Presentation
1 / 18
Title: 1994 Northridge Earthquake
1
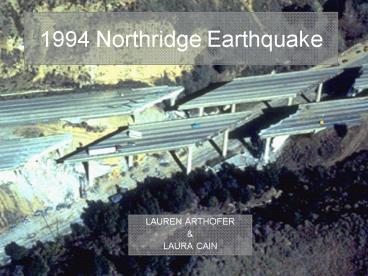
1994 Northridge Earthquake
- LAUREN ARTHOFER
- LAURA CAIN
2
Outline
- Quick Facts
- Geophysical Aspects
- Affect of Earthquake
- Experiment One Data
- Experiment Two Data
- Conclusion
- References
3
Quick Facts
- January 17, 1994
- Northridge
- Magnitude
- 6.7(Richter)
- San Fernando
- Valley
- Northridge/
- Pico Thrust
- Duration 15 seconds
4
Geophysical Aspects
- Pico Fault
- Blind Thrust Fault (most dangerious)
- Size (length) of fault unknown
- Depth 11.8 miles below surface
- North America and Pacific plates
- Aftershock
- Over 300
- Some above 5.0 magnitude
5
Damage
- 57 fatalities and 1500 serious injuries
- 22, 000 people left homeless
- Six bridges failed and four were seriously
damaged - Total Damage Approximately 15 billion
6
Experiment One
I
II
III
- Subjected three structures with different heights
to free vibration - Calculated the period, frequency and damping of
the structures
7
Building One Data
8
Building Two Data
9
Building Three Data
10
Experiment One Conclusion
- From our data, we have concluded that when
subjected to free vibration - The shortest structure had the shortest period
and the highest frequency - The tallest structure had the longest period and
the shortest frequency
11
Experiment Two
- Ran structures through the Northridge earthquake
ground motion on the shake table - Finding the maximum acceleration of the
structures using the period and damping from
experiment one
12
Building One
13
Building Two
14
Building Three
15
Northridge Earthquake Pseudo Acceleration Graph
- Shows the maximum acceleration of a buildings
with different periods and damping.
16
Experiment Two Conclusion
- The shortest building had the largest maximum
acceleration - The tallest structure had the smallest
acceleration
17
Conclusion
- Maximum acceleration of a structure in the
Northridge Earthquake - Caused an enormous amount of damage
- Current building codes significantly decreased
damage - Increased earthquake awareness and preparation
18
References
- http//www.u-s-history.com/pages/h2176.html
- http//www.vibrationdata.com/earthquake/northridge
.htm - http//en.wikepedia.org/wiki/1994_Northridge_Earth
quake - http//www.seismo.unr.edu/ftp/pub/louie/class/100/
magnitude.html - http//pasadena.wr.usgs.gov/office/hudnut/hudnut/n
r_eq.html - http//www.tfhrc.gov/pubrds/summer94/p94su26.htm
- http//pubs.usgs.gov/pp/pp1550/pp1500e/
- http//www.dis-inc.com/northrid.htm
Recommended
CrystalGraphics Presentations


