
One Sample Inf1 - PowerPoint PPT Presentation
1 / 6
Title:
One Sample Inf1
Description:
The Quick diet, by contrast, shows no significant weight loss by its dieters. ... small weight loss was significant, whereas Quick's larger weight loss was not! ... – PowerPoint PPT presentation
Number of Views:136
Avg rating:3.0/5.0
Title: One Sample Inf1
1
Example Practical Significance vs. Statistical
Significance
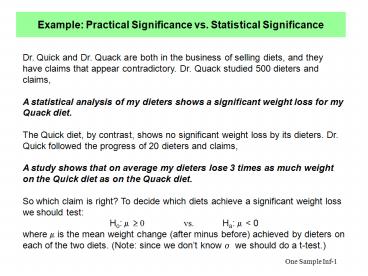
Dr. Quick and Dr. Quack are both in the business
of selling diets, and they have claims that
appear contradictory. Dr. Quack studied 500
dieters and claims, A statistical analysis of my
dieters shows a significant weight loss for my
Quack diet. The Quick diet, by contrast, shows
no significant weight loss by its dieters. Dr.
Quick followed the progress of 20 dieters and
claims, A study shows that on average my dieters
lose 3 times as much weight on the Quick diet as
on the Quack diet. So which claim is right? To
decide which diets achieve a significant weight
loss we should test Ho ? ? 0 vs. Ha ? lt 0
where ? is the mean weight change (after minus
before) achieved by dieters on each of the two
diets. (Note since we dont know ? we should do
a t-test.)
2
MTB output for Quick diet analysis (Stat ? Basic
Stats ? 1 - Sample t) One-Sample T Quick Test of
mu 0 vs lt 0
95
Upper Variable N Mean
StDev SE Mean Bound T P Quick
20 -3.02119 34.16614 7.63978 10.18901 -0.40
0.348 Calculating power for mean null
difference Alpha 0.05 Assumed standard
deviation 35 Sample Difference
Size Power 3 20
0.0219603 Stat ? Nonparametrics ? 1 Sample
Sign Sign Test for Median Quick Sign test of
median 0.00000 versus lt 0.00000 N
Below Equal Above P Median Quick 20
11 0 9 0.4119 -5.036 Sign confidence
interval for median
Confidence Achieved
Interval N Median Confidence Lower
Upper Position Quick 20 -5.036 0.8847
-13.129 4.038 7
0.9500 -24.126 4.219 NLI
0.9586 -27.509 4.274 6
3
(No Transcript)
4
- R output for Quack diet analysis (Read 500 values
into vector quack) - gt t.test(quack,alternativec("less"),mu0,conf.lev
el0.95) - One Sample t-test
- data quack
- t -1.7806, df 499, p-value 0.03779
- alternative hypothesis true mean is less than 0
- 95 percent confidence interval
- -Inf -0.09036075
- sample estimates
- mean of x
- -1.212730
- gt power.t.test(n500,delta1,sd15,type"one.sampl
e", - alternative"one.sided")
- n 500, delta 1, power 0.438
5
- Summary
- Quicks average weight loss of 3.02 is almost 3
times as much as the 1.21 weight loss reported by
Quack. - However, Quacks small weight loss was
significant, whereas Quicks larger weight loss
was not! So Quack might not have a better diet,
but he has more evidence, 500 cases compared to
20. - Remarks
- Significance is about evidence, and having a
large sample size can make up for having a small
effect. - If you have a large enough sample size, even a
small difference can be significant. If your
sample size is small, even a large difference may
not be significant. - Quick needs to collect more cases, and then he
can easily dominate the Quack diet (though it
seems like even a 3 pound loss may not be enough
of a practical difference to a dieter). - Both the Quick Quack statements are somewhat
empty. Its not enough to report an estimate
without a measure of its variability. Its not
enough to report a significance without an
estimate of the difference. A confidence interval
solves these problems.
6
A confidence interval shows both statistical and
practical significance. Quack two one-sided 95
CIs
One-sided CI says mean is sig. less than zero.
Quick two one-sided 95 CIs
One-sided CI says mean is NOT sig. less than
zero.