
Obesity Trends Among U.S. Adults BRFSS, 1985 - PowerPoint PPT Presentation
1 / 82
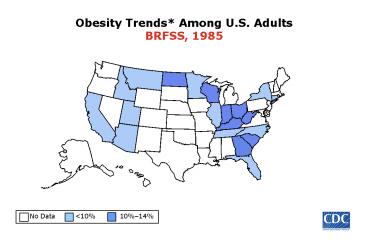
Title: Obesity Trends Among U.S. Adults BRFSS, 1985
1
Obesity Trends Among U.S. AdultsBRFSS, 1985
2
Obesity Trends Among U.S. AdultsBRFSS, 1986
3
Obesity Trends Among U.S. AdultsBRFSS, 1987
4
Obesity Trends Among U.S. AdultsBRFSS, 1988
5
Obesity Trends Among U.S. AdultsBRFSS, 1989
6
Obesity Trends Among U.S. AdultsBRFSS, 1990
7
Obesity Trends Among U.S. AdultsBRFSS, 1991
8
Obesity Trends Among U.S. AdultsBRFSS, 1992
9
Obesity Trends Among U.S. AdultsBRFSS, 1993
10
Obesity Trends Among U.S. AdultsBRFSS, 1994
11
Obesity Trends Among U.S. AdultsBRFSS, 1995
12
Obesity Trends Among U.S. AdultsBRFSS, 1996
13
Obesity Trends Among U.S. AdultsBRFSS, 1997
14
Obesity Trends Among U.S. AdultsBRFSS, 1998
15
Obesity Trends Among U.S. AdultsBRFSS, 1999
16
Obesity Trends Among U.S. AdultsBRFSS, 2000
17
Obesity Trends Among U.S. AdultsBRFSS, 2001
No Data 1519 2024 25
18
Obesity Trends Among U.S. AdultsBRFSS, 2002
(BMI ?30, or 30 lbs overweight for 54 person)
No Data 1519 2024 25
19
Obesity Trends Among U.S. AdultsBRFSS, 2003
No Data 1519 2024 25
20
Obesity Trends Among U.S. AdultsBRFSS, 2004
No Data 1519 2024 25
21
Obesity Trends Among U.S. AdultsBRFSS, 2004
No Data 1519 2024 25
22
Obesity Trends Among U.S. AdultsBRFSS, 2005
No Data 1519 2024 2529
30
23
Percent of adults who are overweight or obese
67
2/3 of adults are overweight or obese
24
Percent of adults who are overweight or obese
81
25
Percent of adults who are overweight or obese by
country
US 74
Russia 50
Percent
India 16
WHO, 2007
26
Excess Body Weight and Reduction of Lifespan
-3.1
-3.3
-5.8
-7.1
Ann Intern Med. 200313824-32
27
Diabetes Among Adults in the U.S.,BRFSS 1990
28
Diabetes Among Adults in the U.S.,BRFSS 1992
29
Diabetes Among Adults in the U.S.,BRFSS 1994
30
Diabetes Among Adults in the U.S.,BRFSS 1996
31
Diabetes Among Adults in the U.S.,BRFSS 1997
32
Diabetes Among Adults in the U.S.,BRFSS 1998
33
Diabetes Among Adults in the U.S.,BRFSS 1999
34
Diabetes Among Adults in the U.S.,BRFSS 2000
35
Diabetes Among Adults in the U.S.,BRFSS 2001
36
Diabetes and Reduction in Lifespan
-14.3 yrs
-11.6 yrs
JAMA 20032901884-1890
37
Lifetime Risk of Diabetes for Children Born in
2000
49
Venkat Narayan, JAMA 20032901884
38
Life Expectancy in the U.S.
2-5 year decline in life expectancy
39
Lifespan in Utah vs US
MMWR 199746444-51
40
What about Utah residents?
- Low rates of cancer and heart disease compared to
other states - Live a little longer
- 7-9 smoke compared to 21 (US)
- Have more body fat now than at any other time in
recorded history
41
What about Utah residents?
- Low rates of cancer and heart disease compared to
other states - Live a little longer
- 7-9 smoke compared to 21 (US)
- Have more body fat now than at any other time in
recorded history
42
(No Transcript)
43
Lifetime Risk for Chronic Disease
44
How People Died in 2003
Cancer 24
Accidents Suicide Infections Kidney failure Lung
failure Others 40
Cardiovascular Disease 36
45
How People Died in 2003
CVD
Cancer
Other
Up to 70 of all causes of death are lifestyle
related and preventable
The Culprit and The Cure, 2005
46
National prevalence of lifestyle related health
risks
80
78
CDC, BRFSS, 2005
47
Percent of Chronic Diseases That Are Caused by
Poor Lifestyle
91
82
71
70
Sources Stampfer, 2000 Platz, 2000 Hu, 2001
48
How did we get this way?
49
(No Transcript)
50
5-a-day 1 million
Food Marketing 25 Billion
51
(No Transcript)
52
Texas Double Whopper
53
(No Transcript)
54
(No Transcript)
55
Individual Behavior
- Awareness/education
- Motivation
- Tools, strategies
- Policy and environment
- Social Determinants of Health
56
Individual
57
(No Transcript)
58
(No Transcript)
59
(No Transcript)
60
(No Transcript)
61
16 oz
32 oz
44 oz
52 oz
64 oz
62
Individual
Family
63
(No Transcript)
64
(No Transcript)
65
Individual
Family
Worksite
66
(No Transcript)
67
(No Transcript)
68
Individual
Family
Worksite
Community
69
(No Transcript)
70
Texas Double Whopper
71
(No Transcript)
72
(No Transcript)
73
(No Transcript)
74
Nation/ world
Individual
Family
Worksite
Community
75
Percent of adults who are overweight or obese by
country
US 74
Russia 50
Percent
India 16
WHO, 2007
76
Childhood Obesity
- 27 of children are overweight (CDC, 2003)
77
Western Diet Pattern
78
(No Transcript)
79
Compression of Morbidity
Morbidity
Lifespan in years
76
0
critical illness
Ann Intern Med, 2003139455-459
80
Compression of Morbidity
Morbidity
Lifespan in years
0
?
76
86
critical illness
81
End of Life Benefits
Morbidity
Lifespan in years
10-20 Years
Morbidity
Lifespan in years
82
(No Transcript)
Recommended
CrystalGraphics Presentations


