
RBS Darwin Maule - PowerPoint PPT Presentation
1 / 31
Title:
RBS Darwin Maule
Description:
RBS Darwin Maule – PowerPoint PPT presentation
Number of Views:55
Avg rating:3.0/5.0
Title: RBS Darwin Maule
1
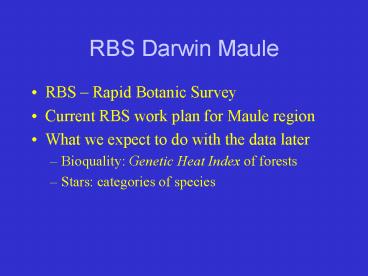
RBS Darwin Maule
- RBS Rapid Botanic Survey
- Current RBS work plan for Maule region
- What we expect to do with the data later
- Bioquality Genetic Heat Index of forests
- Stars categories of species
2
RBS Rapid Botanic Survey
- Rapid 2 or more samples /day inform about all
plants in a defined landscape unit. Plant species
are harvested - Botanic usually all vascular plants
- Survey samples across many patches of forest
across a region or nation or study area
- Field methods analysis developed in Ghana,
Cameroon, Ivory Coast, Sierra Leone, Malaysia,
Honduras, Mexico, Trinidad Tobago
3
RBS and other botanical samples
- Hybrid between normal herbarium collection
strategy and forestry or vegetation plots - RBS tailored to rapid data collection for
prioritising biodiversity conservation - Produces more complete data for each patch of
forest than normal herbarium databases - Similar to Braun-Blanquet and other surveys, but
samples and methods less structured, unmeasured,
for faster and different analyses - Growth rates, timber volumes etc. not possible
4
Aims of RBS
- Rapidly build a database of plant distribution
- Help prioritise forests for conservation
- Provide data for bio-quality analysis
- Objective score for environmental impact
assessment. What is the value of the forest lost
to this mine? - To inform about species distribution and forest
types - To inform about plant ecology. Does this species
occur mostly ion disturbed/ swampy habitats? - Get people out into the field to increase their
botanical wisdom and to collate botanical with
other data e.g. photos, local opinions
5
Rapid Botanic Survey basics
- 2-4 hand-picked sample areas day
- Simply record (collect) all plant species in a
given landscape unit e.g. along forest stream
A or along logging road b until new species
records are exhausted. - Count individual canopy trees (gt30 cm DBH or
gt10cm in low forest) - Ideally gt40 species AND gt40 trees before
stopping, but more is no problem, and if fewer
exist in the area, so be it. - Photograph species for promotion of outputs
6
RBS in Honduras, Mexico
7
Darwin Trinidad RBS team
8
(No Transcript)
9
RBS plans for Chile
10
January 2007 team develops skills in Quile
11
January 2007 RBS tried and discussed in various
vegetation types
12
(No Transcript)
13
Plans for sampling Maule
- Where Maulinos coastal forests
- When Dry season, spring season
- Who Project team
- How Strategy ----
- extensive survey (region level, 75 points)
- intensive survey (local level, x points)
e.g. 13 or 12 (depending
on the landscape)
14
What next? Data flow
Literature, WWW
RBS
Analyses Maps, Reports
Database
WWW Images, data
Herbarium Data
Consensus refinement Stars etc
15
BRAHMS outline
16
Ordination of RBS data
- RBS data can be put to many uses, e.g.
vegetation ordinations and other user-designed
indexes, like Pioneer Index or medicinal
species in flora
17
Bioquality
- Bio diversity is only about numbers of species in
an area, as if all were equal - Bioquality is about the concentration of valued
species in an area, especially species only found
in a few areas and so valued from a global
conservation point of view - The Genetic Heat Index is a standardised index of
global bio-quality designed for use with RBS and
other check-list data
18
GHI Genetic Heat Index
- GHI is an index of bio-quality, showing degree of
endemicity in a sample (any size) of species - Endemic species on its own means little all
species are endemic to somewhere - Species restricted to smaller parts of the world
contribute a higher score for GHI calculations
19
Route to GHI via Stars
RBS samples in field (species list)
Put Species in categories Called Stars
Calculate weights for Stars
Calculate GHI 100 x (No. Species in each star x
weight) /Number of spp.
20
Stars
- All Species put into categories called Stars
- For practical reasons, based on available data in
herbaria, flora, monographs - E.g. Black Star species very restricted range
and of high conservation concern - Green Star species of no conservation concern,
with wide range - Gold and Blue intermediate.
- Green star species which are widespread but
mostly threatened by heavy exploitation can be
defined as Red Stars
21
Summary of Stars
Black Most rare or taxonomically extreme
Gold
Blue
Green Common and widespread not unusual
SCARLET As Green, but highly overexploited
RED As Green, but heavily exploited
PINK As Green, but some exploitation
22
Defining Star of each species
Global range, Chile range, ecology, Local
abundance, taxonomy
Refine Criteria for Stars
- Mean degree (or 100km) square ranges of Stars in
various countries should be similar - Stars define global rarity and conservation
priority, so base mostly on biogeography but with
some attention to taxonomy ecology. - Agreement and review with other botanists useful
- Criteria must be practical to implement
Find average no. of degree squares For subset
of species of each Star
Weights for each Star
Assign Stars to species
Implement In rules guidelines
23
Species distribution maps
Distribution maps of herbarium collections of
various African species of limited distribution
Known distribution of typical widespread (Green
Star) species of African forest (c. 100 degree
squares)
24
Calculation of weights
- Example from Honduras /Mexico
- Weights may differ in different countries due to
need to keep criteria simple - No. degree squares calculated for a subset of
species of each square, depending on available
maps and recent monographs
25
e.g. Star Criteria for Chile?
26
(Chile Argentina)
(Chile Argentina)
?
Open areas from Ecuador to Argentina
Argentina, New Z
27
Calculation of GHI
The Weight in B. for each Star is in inverse
proportion to the number of degree squares
occupied on average by the species of that Star
relative to Green. Green Star weights are then
set to zero.
28
Bioquality map
- GHI scores interpolated (krigging in Surfer) to
indicate local hotspots in Ghana
29
Variation of GHI in Ghana
30
Photo libraries and web presence
- Database of plant distribution and photographs
for future use - Presence of Talca bioquality on web opens
opportunities and adds publicity
31
Thanks
- William Hawthorne says many thanks to the
Darwin-Maule team for a great stay in Chile,
enthusiastic and interesting field work (and
pretending to understand my sign language) - José San Martin, Patricio Peñailillo, Rolando
Garcia, Persy Gomez (UTAL) - Cesar Sepúlveda Pedro Garrido (Codeff) Franz
Arnold (consultant) Carolinas Rojas (Celco)
Recommended
CrystalGraphics Presentations


