
1 5: Scatter Plots - PowerPoint PPT Presentation
1 / 13
Title:
1 5: Scatter Plots
Description:
Plot the following points and then join them in order to determine the shape the points make: ... between x and y, if any, suggested by each of these scatter ... – PowerPoint PPT presentation
Number of Views:136
Avg rating:3.0/5.0
Title: 1 5: Scatter Plots
1
1 5 Scatter Plots
2
Student Objectives
- You will know how to plot scatter graphs.
- You will be able to use scatter graphs to
describe a relationship, if any, between 2
quantities. - You will be able to draw a trend line.
- You will be able to identify correlation.
- You will be able to use trend lines to find
missing values, when this is appropriate.
3
- Draw a coordinate grid on paper, with 0 to 10 on
the x-axis and y-axis. - Plot the following points and then join them in
order to determine the shape the points make - a) (2, 6), (2, 9), (5, 9), (5, 6)
- b) (3, 1), (1, 3), (3, 5), (5, 3)
4
(No Transcript)
5
Plot these mens salaries against their height.
Trend Line -
Correlation -
6
Plot the diameter of a spot of mould against the
number of days it has been growing.
Kind of Correlation?
7
Plot the number of natural teeth a person has
against their age.
8
Positive Correlation -
- the trend line is going 'up hill', so as the x
variable increases, so does the y variable. - the trend line is going 'down hill', so as the x
variable decreases, so does the y variable.
Negative Correlation -
9
Describe the Correlation between x and y, if any,
suggested by each of these scatter graphs.
POSITIVE CORRELATION!
NEGATIVE CORRELATION!
NO CORRELATION! (or ZERO CORRELATION!
10
Questions for you
- What would be the height of a man who makes a
salary of 135 British pounds? - What is the salary of a man who is 1.4 meters?
- How many days has the mould been growing if it
has a diameter of 10 mm? - How old is a person who has 15 teeth?
- How many teeth would a child of age 5 have?
11
Describe the relationship, if any, between x and
y, suggested by each of these scatter graphs
12
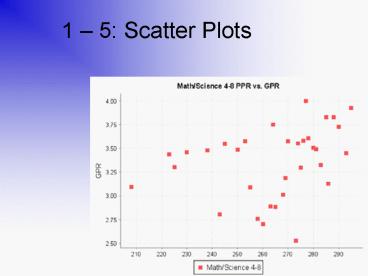
What do these scatter graphs show about the
science and maths test mark of two classes?
Maths mark
Science mark
13
- Person 1 Get graph paper and plot the data.
- Person 2 Look at the data and decide what the
relationship is in the data (this is words
a.k.a. a sentence). - Person 3 - Decide the correlation of the data.
- Person 4 - Present you scatter graph to the
class, telling the relationship from Person 2 and
the correlation from Person 3. - Everyone should help each other out!!
Recommended
CrystalGraphics Presentations


