
Bright blue marble spinning in space - PowerPoint PPT Presentation
1 / 37
Title: Bright blue marble spinning in space
1
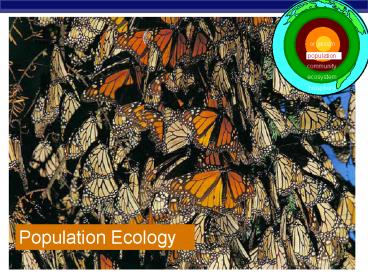
organism
population
community
ecosystem
biosphere
Population Ecology
2
Life takes place in populations
- Population
- group of individuals of same species in same area
at same time
- rely on same resources
- interact
- interbreed
Population Ecology What factors affect a
population?
3
Why Population Ecology?
- Scientific goal
- understanding the factors that influence the size
of populations - general principles
- specific cases
- Practical goal
- management of populations
- increase population size
- endangered species
- decrease population size
- pests
- maintain population size
- fisheries management
- maintain maximize sustained yield
4
Factors that affect Population Size
- Abiotic factors
- ____________________
- ____________________
- ____________________
- Biotic factors
- ____________________
- ____________________
- ____________________
- ____________________ ____________________
- Intrinsic factors
- adaptations
5
Characterizing a Population
- Describing a population
- population ___________
- pattern of spacing
- ____________
- size of population
range
density
6
Population Range
- Geographical limitations
- abiotic biotic factors
- temperature, rainfall, food, predators, etc.
- habitat
adaptations topolar biome
adaptations torainforest biome
7
Changes in range
- Range expansions contractions
- changing environment
result of competition
8
At risk populations
- Endangered species
- limitations to range / habitat
- places species at risk
9
Population Spacing
- Dispersal patterns within a population
Provides insight into the environmental
associations social interactions of
individuals in population
clumped
random
uniform
10
Clumped Pattern (most common)
11
Uniform
May result from direct interactions between
individuals in the population ? territoriality
Clumped patterns
12
Population Size
- Changes to population size
- adding removing individuals from a population
- birth
- death
- immigration
- emigration
13
Population growth rates
- Factors affecting population growth rate
- sex ratio
- how many females vs. males?
- generation time
- at what age do females reproduce?
- age structure
- how females at reproductive age in cohort?
14
Demography
Why do teenage boys pay high car insurance rates?
- Factors that affect growth decline of
populations - vital statistics how they change over time
Life table
females
males
15
Survivorship curves
- Graphic representation of life table
The relatively straight lines of the plots
indicate relatively constant rates of death
however, males have a lower survival rate overall
than females.
Belding ground squirrel
16
Age structure
- Relative number of individuals of each age
What do the data imply about population growth in
these countries?
17
Survivorship curves
What do these graphs tell about survival
strategy of a species?
- Generalized strategies
I. High death rate in post-reproductive years
II. Constant mortality rate throughout life span
III. Very high early mortality but the few
survivors then live long (stay reproductive)
18
Trade-offs survival vs. reproduction
- The cost of reproduction
- increase reproduction may decrease survival
- investment per offspring
- reproductive events per lifetime
- age at first reproduction
Natural selection favors a life history that
maximizes lifetime reproductive success
19
Parental survival
- Kestrel Falcons
- The cost of larger broods to both male female
parents
20
Reproductive strategies
- _____________________________
- _________________________
- _________________________
- _________________________
- primates
- coconut
- _____________________________
- _________________________
- _________________________
- _________________________
- insects
- many plants
K-selected
r-selected
21
Trade offs
- Number size of offspring
- vs.
- Survival of offspring or parent
r-selected
K-selected
Of course, long before you mature, most of you
will be eaten.
22
Life strategies survivorship curves
23
Population growth
- change in population births deaths
- Exponential model (ideal conditions)
- dN riN
- dt
growth increasing at constant rate
N of individuals r rate of growth ri
intrinsic rate t time d rate of change
every pair has 4 offspring
every pair has 3 offspring
intrinsic rate maximum rate of growth
24
Exponential growth rate
- Characteristic of populations without
_______________________ - introduced to a new environment or rebounding
from a catastrophe
African elephant protected from hunting
Whooping crane coming back from near extinction
25
Regulation of population size
marking territory competition
- Limiting factors
- ____________________
- _____________________
- _____________________
- _____________________
- _____________________
- ____________________
- _____________________
- _____________________
- _____________________
- _____________________
swarming locusts
competition for nesting sites
26
Introduced species
- Non-native species
- transplanted populations grow exponentially in
new area - out-compete native species
- loss of natural controls
- lack of predators, parasites, competitors
- reduce diversity
- examples
- African honeybee
- gypsy moth
- zebra mussel
- purple loosestrife
kudzu
27
Zebra mussel
2 months
ecological economic damage
28
Purple loosestrife
- reduces diversity
- loss of food nesting sites for animals
29
Logistic rate of growth
- Can populations continue to grow exponentially?
Of course not!
no natural controls
K Carryingcapacity
effect of natural controls
What happens as N approaches K?
30
Carrying capacity
- Maximum population size that environment can
support with no degradation of habitat - varies with changes in resources
Whats going on with the plankton?
31
Changes in Carrying Capacity
- Population cycles
- predator prey interactions
32
Human population growth
Population of China 1.3 billion India 1.1
billion
adding 82 million/year
- What factors have contributed to this exponential
growth pattern?
2005?6 billion
Is the human population reachingcarrying
capacity?
Bubonic plague "Black Death"
1650?500 million
33
Distribution of population growth
11
uneven distribution 90 of births in developing
countries
10
high fertility
9
uneven distribution of resources increasing gap
between rich poor
medium fertility
8
7
low fertility
6
World total
World population in billions
What is K for humans? 10-15 billion?
5
4
Developing countries
3
2
1
Developed countries
0
1950
1900
2000
2050
Time
34
Distribution of population growth
11
uneven distribution 90 of births in developing
countries
10
high fertility
9
uneven distribution of resources increasing gap
between rich poor
medium fertility
There are choices as to which future path the
world takes
8
7
low fertility
6
World total
World population in billions
What is K for humans? 10-15 billion?
the effect of income education
5
4
Developing countries
3
2
1
Developed countries
0
1950
1900
2000
2050
Time
35
Ecological Footprint
over-population or over-consumption?
uneven distribution wealthiest 20 of world 86
consumption of resources 53 of CO2 emissions
36
Ecological Footprint
deficit
surplus
Based on land water area used to produce all
resources each country consumes to absorb all
wastes it generates
37
Any Questions??