
ESAP T0201 1 - PowerPoint PPT Presentation
1 / 7
Title:
ESAP T0201 1
Description:
Outputs Category Line Plot Category Bar Graph Category Pie Chart. Limitations 12 Categories ... 01 - 7. The Pie Chart displays a pie representation of the ... – PowerPoint PPT presentation
Number of Views:57
Avg rating:3.0/5.0
Title: ESAP T0201 1
1
T02-01 Quick Graphs (Line Plot, Bar Graph, Pie
Chart)
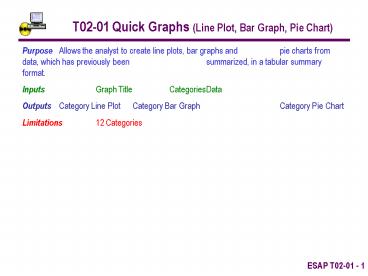
Purpose Allows the analyst to create line plots,
bar graphs and pie charts from data, which has
previously been summarized, in a tabular
summary format. Inputs Graph Title Categories Da
ta Outputs Category Line Plot Category Bar
Graph Category Pie Chart Limitations 12
Categories
2
T02-01 Quick Graphs (Line Plot, Bar Graph, Pie
Chart)
An Example A survey has produced the following
tabular results. The analyst wants to view a
graphic Line Plot, Bar Graph, and Pie Chart of
the Frequency shown in the tabular data.
3
The Graph Title and Category Labels are entered
in the bright green cells. The Category Values
are entered in the light green cells.
4
Worksheet Tabs can be selected to view the Line
Plot, Bar Graph Pie Chart.
5
The Line Plot displays line representation for
the Category Values
6
The Bar Graph displays a bar representation of
the Category Values
7
The Pie Chart displays a pie representation of
the Category Values