
The hydrologic cycle - PowerPoint PPT Presentation
1 / 11
Title:
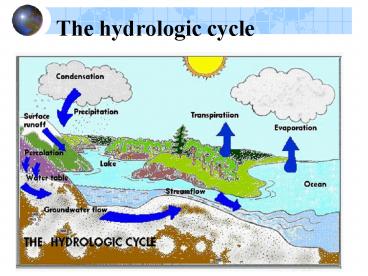
The hydrologic cycle
Description:
The glass ball focuses the light and burns the card. as the sun track across the sky. ... (psychrometric constant) 66.6 Pa/oC. 0 ... – PowerPoint PPT presentation
Number of Views:135
Avg rating:3.0/5.0
Title: The hydrologic cycle
1
The hydrologic cycle
2
Soil Vegetation Column
Water Balance Equations
Energy Balance Equation
3
Sunshine Ball measures hours of bright sunshine
Sunshine card
4
Sunshine Card
The glass ball focuses the light and burns the
card as the sun track across the sky. The length
of the burn indicates hours of bright sunshine.
5
5. Mass Transfer / Aerodynamic Method
- It estimates evaporation from modeling mass
momentum transport of water vapor from
evaporating surface by convection. - Ea f(U)(es - ea)
- Where f(U) Mass transfer coefficient
- U windspeed (m/day or m/s) usually measured at
a height of 2 m above the ground - es Saturation vapor pressure of air at Ta,
- ea Actual atmospheric vapor pressure of air
(air is often not saturated with vapor).
6
- Zo Roughness height of vegetation (0.005 m to a
few meters) - Za Height where measurements are taken
- U Wind velocity in m/sec
- k Von Karmans constant (0.4)
- Patmospheric pressure
- ?a and ?w Density of air and water
7
6. Penman (1948) Combination Method
- By assuming a thin free-water surface, Penman
derived a equation that combines both features of
the aerodynamic and the energy methods, known as
the combination method. The most physically-based
evaporation model derived from several basic
equations.
ea, Ta
Rn
Air
Wind (U)
Water
eo, To
8
0
- Net radiation Rn lvEn G H (1)
- Bowens ratio ? H/lvE (2)
- Saturation vapor pressure gradient D des/dT
- Mass transfer Ea f(U)(es - ea) (3)
- D saturation vapor pressure gradient,
- ? (psychrometric constant) ? 66.6 Pa/oC
9
ER D calibrated from ET simulated by 2-Source
model for Paddle River Basin that of Granger
Grey (1989)
10
2-Source versus Penman-Monteith
11
2-Source versus Modified Penman
Recommended
CrystalGraphics Presentations


