
Figure 54'0 A terrarium, an example of an ecosystem - PowerPoint PPT Presentation
1 / 38
Title:
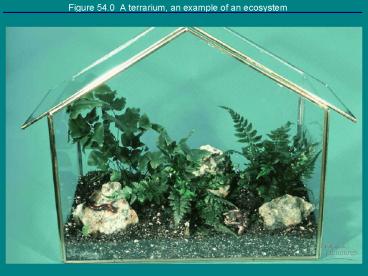
Figure 54'0 A terrarium, an example of an ecosystem
Description:
Primary Productivity amount of light energy converted to chemical energy by ... Nitrification. Ammonifiaction. Nitrogen fixation ... – PowerPoint PPT presentation
Number of Views:263
Avg rating:3.0/5.0
Title: Figure 54'0 A terrarium, an example of an ecosystem
1
Figure 54.0 A terrarium, an example of an
ecosystem
2
Figure 54.2 Fungi decomposing a log
3
(No Transcript)
4
Primary Productivity amount of light energy
converted to chemical energy by autotrophs during
a given period of time.Photosynthetic production
energy budget of ecosystem
- Gross Primary Productivity(GPP)
- Amt. of light energy
- Chemical Energy
- per unit of time
- Net Primary
- Productivity (NPP)
- to GPP minus
- energy used by primary producers for
respiration (R)
NPP GPP - R
NPP is key measurement storage of chemical
energy available to consumers in ecosystem
J/m2/yr Or as new Biomass g/m2/yr What
ecosystems are the most productive?
5
Figure 54.3 Primary production of different
ecosystems
6
Figure 54.11 An idealized pyramid of net
production
7
Figure 54.12 Pyramids of biomass (standing crop)
8
Figure 54.13 A pyramid of numbers
9
Figure 54.14 Food energy available to the human
population at different trophic levels
10
What processes are involved in the water cycle?
11
Figure 54.16 The water cycle
12
What processes are primarily responsible for the
carbon cycle?
13
Figure 54.17 The carbon cycle
14
What are the major processes in the nitrogen
cycle?
- Assimilation
- Nitrification
- Ammonifiaction
- Nitrogen fixation
What types of organisms are responsible for each
process?
15
Figure 54.18 The nitrogen cycle
16
Figure 54.19 The phosphorous cycle
17
(No Transcript)
18
Figure 54.20 Review Generalized scheme for
biogeochemical cycles
19
Figure 54.21 Hubbard Brook Experimental Forest
Concrete dams (left), logged watersheds (right)
20
Figure 54.21c Nutrient cycling in the Hubbard
Brook Experimental Forest an example of
long-term ecological research
21
Figure 54.22 Agricultural impact on soil
nutrients
22
Figure 54.23a Distribution of acid precipitation
in North America and Europe
23
Figure 54.23b U.S. map profiling pH averages for
precipitation in 1999
24
Figure 54.24 Weve changed our tune
25
Figure 54.25 Biological magnification of DDT in
a food chain
26
Figure 54.26 The increase in atmospheric carbon
dioxide and average temperatures from 1958 to
2000
27
Figure 54.27a Erosion of Earths ozone shield
The ozone hole over the Antarctic
28
Figure 54.27b Erosion of Earths ozone shield
Thickness of the ozone layer
29
Figure 54.1 An overview of ecosystem dynamics
30
Figure 54.4 Regional annual net primary
production for Earth
31
Figure 54.5 Vertical distribution of
temperature, nutrients, and production in the
upper layer of the central North Pacific during
summer
32
Figure 54.6 Experiments on nutrient limitations
to phytoplankton production in coastal waters of
Long Island
33
Table 54.1 Nutrient Enrichment Experiments for
Sargasso Sea Samples
34
Figure 54.7 Remote sensing of primary production
in oceans
35
Figure 54.8 The experimental eutrophication of a
lake
36
Figure 54.9 Nutrient addition experiments in a
Hudson Bay salt marsh
37
Figure 54.10 Energy partitioning within a link
of the food chain
38
Figure 54.15 A general model of nutrient cycling
Recommended
CrystalGraphics Presentations


