
HIPPO: Global Carbon Cycle - PowerPoint PPT Presentation
1 / 41
Title: HIPPO: Global Carbon Cycle
1
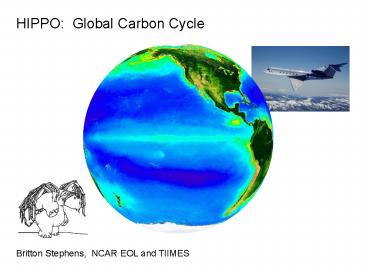
HIPPO Global Carbon Cycle
Britton Stephens, NCAR EOL and TIIMES
2
Careful atmospheric CO2 measurements since the
1950s show that about half of fossil fuel
emissions remain in the atmosphere
FF
Atm
IPCC, 2007
3
Annual fluxes are small relative to balanced
seasonal exchanges and to standing pools
Annual residuals
Pools and flows
Land-Based Sink
Net Oceanic Sink
Uncertainties on natural annual-mean ocean and
land fluxes are /- 25 to 75
The global carbon cycle for the 1990s, showing
the main annual fluxes in GtC yr 1. IPCC, 2007
4
Global atmospheric inverse models and surface
data have been used to make regional flux
estimates
Forward Flux Transport CO2
Inverse CO2 Transport Flux
5
12 Model Results from the TransCom 3 Study
Systematic trade off between northern and
tropical land fluxes
6
Regional land flux uncertainties are very large
- All model average and standard deviations
- Northern Land -2.4 1.1 PgCyr-1
- Tropical Land 1.8 1.7 PgCyr-1
7
Bottom-up estimates have generally failed to find
large uptake in northern ecosystems and large net
sources in the tropics
8
A helpful discovery about the nature of the model
disagreements
Tropical Land and Northern Land fluxes plotted
versus vertical CO2 gradient
Systematic trade off is related to vertical
mixing biases in the models
9
12 Airborne Sampling Programs from 6
International Laboratories
Northern Hemisphere sites include Briggsdale,
Colorado, USA (CAR) Estevan Point, British
Columbia, Canada (ESP) Molokai Island, Hawaii,
USA (HAA) Harvard Forest, Massachusetts, USA
(HFM) Park Falls, Wisconsin, USA (LEF) Poker
Flat, Alaska, USA (PFA) Orleans, France (ORL)
Sendai/Fukuoka, Japan (SEN) Surgut, Russia
(SUR) and Zotino, Russia (ZOT). Southern
Hemisphere sites include Rarotonga, Cook Islands
(RTA) and Bass Strait/Cape Grim, Australia (AIA).
10
12 Airborne Sampling Programs from 6
International Laboratories
11
Model-predicted NH Average CO2 Contour Plots
Observed NH Average CO2 Contour Plot
12
Comparing the Observed and Modeled Gradients
- 3 models that most closely reproduce the observed
annual-mean vertical CO2 gradients (4, 5, and C)
- Northern Land
- -1.5 0.6 PgCyr-1
- Tropical Land
- 0.1 0.8 PgCyr-1
- All model average
- Northern Land
- -2.4 1.1 PgCyr-1
- Tropical Land
- 1.8 1.7 PgCyr-1
Northern Land Tropical Land
Most of the models overestimate the annual-mean
vertical CO2 gradient
Observed value
13
Seasonal vertical mixing
figure courtesy of Scott Denning
14
- Airborne measurements suggest
- Northern forests, including U.S. and Europe, are
taking up much less CO2 than previously thought - Intact tropical forests are strong carbon sinks
and are playing a major role in offsetting carbon
emissions
Stephens et al., Science, 2007
However, large (O 2 PgCyr-1) flux uncertainties
associated with modeling atmospheric CO2
transport remain
15
Transcom3 Tropical Asia Response
pressure
N
S
N
S
N
S
N
S
ppm
ppm
latitude
16
Transcom3 Southern Ocean Response
pressure
N
S
N
S
N
S
N
S
ppm
ppm
latitude
17
Air-Sea Flux ComparisonContemporary Fluxes 1992-6
courtesy A. Jacobsen
18
Transcom3 Fossil Fuel Response
pressure
N
S
N
S
N
S
N
S
ppm
ppm
latitude
19
(No Transcript)
20
TransCom Seasonal APO Amplitude
T. Blaine, SIO Dissertation, 2005
21
START Gravitational Fractionation
Ishidoya et al., O2/N2 in the Stratosphere, GRL,
2006
22
Ishidoya et al., O2/N2 in the Stratosphere, GRL,
2006
Stratospheric O2 and N2 Observations
Observations Corrected for Gravitational
Fractionation
- This study 12 samples per balloon flight, 40
per meg precision in O2/N2 - START-08 AO2 5-second sampling at 5 per
meg precision in O2/N2 - START-08 MEDUSA 16 samples per flight, 2
per meg precision in O2/N2 and 10 per meg
precision in Ar/N2 - Gravitational fractionation 3 X greater for
Ar/N2
23
Many other relevant species will be measured,
including
SF6
NOAA ESRL
24
(No Transcript)
25
(No Transcript)
26
Altitude-time CO2 contour plots for all sampling
locations
27
Vertical CO2 profiles for different seasonal
intervals
28
Transcom3 neutral biosphere flux response
Rectifier Effect
ppm
Latitude
29
TransCom3 model results based on surface data
imply a large transfer of carbon from tropical to
northern land regions.
Level 1 (annual mean)
Level 2 (seasonal)
Gurney et al, Nature, 2002
Gurney et al, GBC, 2004
30
TransCom 3 Level 2 annual-mean model fluxes
(PgCyr-1)
Comparison to other studies
fluxes in PgCyr-1 GtCyr-1 billions of tons
of C per year
_at_ 3 - 30 / ton, 3 PgCyr-1 10 - 100 billion
/ year
31
TransCom3 predicted rectifier explains most of
the variability in estimated fluxes
32
Estimated fluxes versus predicted 1 km 4 km
gradients for different seasonal intervals
Observed values
33
HIAPER Pole-to-Pole Observations of Atmospheric
Tracers
HIPPO (PIs Harvard, NCAR, Scripps, and NOAA) A
global and seasonal survey of CO2, O2, CH4, CO,
N2O, H2, SF6, COS, CFCs, HCFCs, O3, H2O, and
hydrocarbons
Fossil fuel CO2 gradients over the Pacific
UCI
UCIs
pressure
N
S
N
S
JMA
MATCH.CCM3
pressure
N
S
N
S
ppm
34
How can we separate the natural uptake between
land and ocean?
Sabine et al, Science, 2004
35
Uncertainties on natural ocean and land fluxes
are /- 25 to 75
Annual residuals
Land-Based Sink
Net Oceanic Sink
IPCC, 2007 and Canadell et al., PNAS 2007
36
Regional land flux uncertainties are very large
- All model average and standard deviations
- Northern Land -2.4 1.1 PgCyr-1
- Tropical Land 1.8 1.7 PgCyr-1
- At 30/ton of CO2
- 1.5 PgCyr-1 165 Billion
37
COBRA-NA 2000
CO2
CO
North
South
38
Transcom3 Neutral Biosphere Response
pressure
N
S
N
S
N
S
N
S
ppm
ppm
latitude
39
R. Keeling, SIO
40
Manning, 2001
41
Aircraft Data Providers Pieter P. Tans, Colm
Sweeney, Philippe Ciais, Michel Ramonet, Takakiyo
Nakazawa, Shuji Aoki, Toshinobu Machida, Gen
Inoue, Nikolay Vinnichenko, Jon Lloyd, Armin
Jordan, Martin Heimann, Olga Shibistova, Ray L.
Langenfelds, L. Paul Steele, Roger J. Francey
TransCom3 Modelers Kevin R. Gurney, Rachel M.
Law, Scott Denning, Peter J. Rayner, David Baker,
Philippe Bousquet, Lori Bruhwiler, Yu-Han Chen,
Philippe Ciais, Inez Y. Fung, Martin Heimann,
Jasmin John, Takashi Maki, Shamil Maksyutov,
Philippe Peylin, Michael Prather, Bernard C. Pak,
Shoichi Taguchi
Additional Modeling Wouter Peters, Philippe
Ciais, Philippe Bousquet, Lori Bruhwiler
Recommended
CrystalGraphics Presentations


