
Chapter 5. Norms and Criteria: - PowerPoint PPT Presentation
Title:
Chapter 5. Norms and Criteria:
Description:
The 'father' of the IQ test was Alfred Binet. ... Terman administered IQ tests, written in English, to Spanish-speakers and non ... Stanford-Binet IQ Test ... – PowerPoint PPT presentation
Number of Views:113
Avg rating:3.0/5.0
Title: Chapter 5. Norms and Criteria:
1
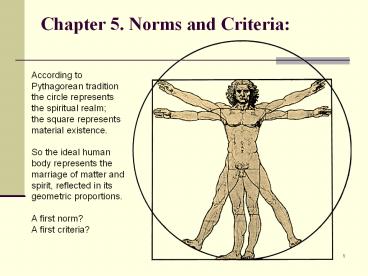
Chapter 5. Norms and Criteria
- According to Pythagorean tradition
- the circle represents the spiritual realm
- the square represents material existence.
- So the ideal human body represents the marriage
of matter and spirit, reflected in its geometric
proportions. - A first norm?
- A first criteria?
2
Topics
- Basic Issues or Decisions to be made
- Should we adjust the raw score before
proceeding? - Norm or Criteria Interpretation . . . Or both?
- Types of Norms
- Percentiles
- Standard Scores
- Developmental norms
- Norm groups
- Criterion-referencing and Performance Standards
- Dynamic Assessment and Self-referencing on
Repeated Measures
3
Adjusting The Raw Score
- We have already noted the most immediate result
from an assessment or test is the raw score.
Sometimes, before we proceed to discuss the
meaning of the score (i.e., interpret it from
either a norm or criteria perspective), the raw
score is adjusted. Usually this is done by
researchers, not classroom teachers. Two special
considerations - Correction for Guessing
- Only for selected-response items
- Use has faded
- Factoring in Item Difficulty
- Students get a higher Theta Score based on
doing well on the more difficult items of a test. - In fact, you may be looking at a test score
report given in percentiles or standard scores
and not realize you are looking at a
transformation from a Theta score rather than the
traditional raw score.
4
Interpreting Student PerformanceNorms or
Criteria . . . .
- Intelligent interpretation of student performance
is crucial for the use of educational assessment
information. We are building toward this with
previous discussions of - Building / choosing good tests
- Determining reliability
- Determining validity
- So now we are set to explore some methods of
interpretation. These methods fall into two
basic categories or approaches - Norm-referenced
- Compare this student with others.
- Criterion-referenced
- Compare this student with some judgment regarding
expected performance level irrespective of
others.
5
Percentile Rankat or below . . .
- Percentiles and Percentile Rank
- Definition of cases at or below
- As we noted earlier, these two terms are
different conceptually, however, in practice
often both terms are used interchangeably. - Strengths
- Easy to describe
- Easy to compute
- Weaknesses
- Confusion with a percentage-right score
- Inequality of units see next slide
6
The illustration of theInequality of Units in
Percentiles
7
Norm-Referenced SystemsTransforming Scores
- Remember, the z score tells how many standard
deviation units a score is away from the mean.
I can take any set of scores I want to norm
(i.e. make judgments by comparing scores to each
other) and create the z distribution. But z
scores are hard for lay people to interpret (a
range from -3 to 3 has little meaning to them). - So, how about if I transform them! Zowee,
Batman! - You will hear people call these transformed
scores many names, names like standard scores,
norms, normed scores, scaled scores.
Double Zowee! - Becoming a standard score
- Definition - conversion from z-score into system
with a nice, arbitrarily chosen M and SD - (see illustration of conversion process on the
next slide)
8
Illustration of the conversion from . . .Raw
Score to Standard Score
9
Cherchez la femme . . .
- Look for the woman, er . . . table
- In ordinary practice, you simply use a table in
the test manual to convert a raw score to a
standard score. - Thus, it is important to understand how this
works, but you would likely never do this
yourself (unless you developed your own test,
e.g. The McEwing Test of Procrastination which
I will someday get around to constructing).
10
Standard Scoresreally a family of scores . . .
some examples
- Intelligence . . . The IQ Score
- One of the most widely implemented, controversial
and misunderstood test scores ever used and
abused. - Historically, schools (and the public) used the
ratio IQ - (IQ MA/CA X 100)
- Today, we use the deviation IQ
- (most appropriately called the school ability
index) - M 100 and SD 15 or 16
- The father of the IQ test was Alfred Binet.
Binet developed the test at the request of a
national commission who wanted to identify
students in need of help in coping with the
school curriculum. (see next slide)
11
Alfred Binet (1857-1911)self-taught French
psychologist
In 1905 Binet had children do tasks such as
follow commands, copy patterns, name objects, and
put things in order. He gave the test to Paris
schoolchildren and created a standard
intelligence scale based on his data. For
example, a 6-year-old child who passed all the
tasks usually passed by 6-year-olds (but no tasks
beyond) would have a mental age that exactly
matched his chronological age, 6.0. In
accordance with the commissions charge, he
reasoned that students testing below age level
should be given help to achieve at levels more
like their age peers. Binet stressed that
intellectual development progressed at variable
rates and could be impacted by the environment
(therefore not based solely on genetics). He
also argued that intelligence was malleable
rather than fixed and IQ testing could only be
used on children with comparable backgrounds.
Along with collaborator Théodore Simon, Binet
published revisions of his intelligence scale in
1908 and 1911, the last appearing just before his
death.
12
Lewis M. Terman (1877-1956)school principal
college professor at Stanford
- Terman admired Binets work. During World War I,
Terman served in the United States army
conducting psychological tests. He and his
students developed the Alpha and Beta tests which
were used to allocate soldiers into the most
appropriate areas of military service. - Terman also adopted William Stern's suggestions
to multiply the mental age / chronological age
ratio times 100 (to get rid of the decimal) and
call the score be called an intelligence quotient
or IQ. Today we usually refer to this approach
to intelligence as the ratio IQ. - In keeping with his army experiences, when Terman
moved to testing classroom children, he proposed
using his Stanford-Binet IQ Test to classify
children and put them on the appropriate
job-track. Terman believed IQ was inherited and
was the strongest predictor of one's ultimate
success in life. By the way, Terman claimed
that he himself had an IQ of 180 . . .
13
Terman the Researcher
- Terman administered IQ tests, written in English,
to Spanish-speakers and non-schooled
African-Americans. From his research he
concluded - High-grade or border-line deficiency . . . is
very, very common among Spanish-Indian and
Mexican families of the Southwest and also among
negroes. Their dullness seems to be racial, or at
least inherent in the family stocks from which
they come . . . . Children of this group should
be segregated into separate classes . . . . They
cannot master abstractions but they can often be
made into efficient workers . . . from a eugenic
point of view they constitute a grave problem
because of their unusually prolific breeding. - (The Measurement of Intelligence, 1916, p.
91-92).
14
Part of the stated goals of theStanford-Binet
IQ Test
- Use of the Stanford-Binet scale in American
schools would (according to Chapter I of the test
manual itself) allow for the scientific
diagnosis and classification of children to be
placed in special classes bring tens of
thousands of high-grade defectives under the
surveillance and protection of society reduce
delinquency help the schools respond to children
of superior intelligence assist in assigning
children to school grades and help determine
vocational fitness . . . . (White, 2000) - NEXT -
- A table related to the deviation IQ is on the
next slide. What do you notice?
15
DEVIATION IQ REFERENCE CHART Wechsler, D. (1944).
The Measurement of Adult Intelligence. Baltimore
The Williams Wilkins Company. Reber, A.S.
(1995). The Penguin Dictionary of Psychology, 2nd
ed. Toronto Penguin Books. I.Q. Basics I.Q.
Comparison Site
Deviation IQ Reference Chart Deviation IQ Reference Chart Deviation IQ Reference Chart Deviation IQ Reference Chart
Intelligence Level Of Pop. Under Level Point Value (15SD) Point Value (16SD)
Idiot 0.0000001 lt10 lt4
Profound Moron 0.000001 lt16 lt10
Exceptional Moron 0.00001 lt22 lt17
Moron 0.0001 lt29 lt24
Extremely Retarded 0.001 lt36 lt32
Highly Retarded 0.01 lt44 lt40
Retarded 0.1 lt54 lt50
Significantly Below Average 1 lt65 lt63
Below Average 10 lt81 lt79
Average 50 100 100
Above Average 90 gt119 gt121
Significantly Above Average 99 gt135 gt137
Gifted 99.9 gt146 gt150
Highly Gifted 99.99 gt156 gt160
Extremely Gifted 99.999 gt164 gt168
Genius 99.9999 gt171 gt176
Exceptional Genius 99.99999 gt178 gt183
Profound Genius 99.999999 gt184 gt190
Savant 99.9999999 gt190 gt196
16
Got Vygotsky?self-taught Russian psychologist
(1896-1934)
Lev Vygotsky graduated with a law degree at
Moscow University. After graduation, he taught
literature in secondary school and psychology at
a teachers college. While Vygotsky had no formal
training in psychology, ideas related to
developmental psychology fascinated
him. Vygotskys thoughts were influenced by
Marxist theorists. Marxists believe that one can
only understand individuals in the context of
their social-historical environment. Similarly,
mental abilities and processes were viewed in
terms of the historical sequence of events that
produced them. Upon his death from
tuberculosis, his ideas were repudiated by the
Soviet government. They banned his work because
he did some research with intelligence tests
(intelligence tests were condemned by the
Communist Party). Vygotsky was actually
criticizing the tests when he was using them in
his research, but this point was lost on the
government officials. When the Cold War ended,
Vygotsky's works were opened to the West.
17
Vygotsky and IQIQ is culturally inherited . . .
not genetically inherited . . .
- Rather than seeing intelligence as much the same
across cultures, Vygotsky saw intellectual
abilities as being much more specific to the
culture (think family, community, nation) in
which the child was reared (Vasta,R., Haith,
M.M., Miller,S.A., 1995). Culture makes two sorts
of contributions to the childs intellectual
development. First, children acquire much of
their thinking (e.g., knowledge) from it.
Second, children acquire the processes or means
of their thinking (e.g., tools of intellectual
adaptation) from the surrounding culture.
Therefore, culture provides the child with the
means to decide both what to think and how to
think. - Vygotsky elaborates this culture as
intelligence idea as follows Every function in
the childs cultural development appears twice
first, between people (inter-psychological) and
then inside the child (intra-psychological). All
the higher functions originate as actual
relationships between individuals. (Vygotsky,
1978) - One might conclude, the richer the personal
interactions, then the richer the mind of the
person. We will come back to this idea later,
for now let us look at more examples of standard
scores.
18
More Standard Scores of Interest . . . .
- T-scores, SATs, GREs
- NCEs (Normal Curve Equivalent)
- Recall that the percentile rank scale is not an
equal-interval scale NCEs solve this problem by
converting percentile ranks to an equal-interval
scale. NCEs range from 1 to 99 with a mean of 50.
The major advantage of NCEs over percentile ranks
is that NCEs can be averaged. - Used almost exclusively by federal reporting
requirement for achievement testing. - Stanines
- Widely used in schools so we will look at them in
more detail in the next slide.
19
More on Staninescontraction of standard nine .
. .
- Stanines divide the normal distribution into 9
units each of which cover the same length along
the base of the normal curve (except the units
which cover the two tails). Stanines have a M
5 and SD 2 and range 1 (lowest) 9 (highest). - Stanines can be used to convert any test score
into a single digit number. This was valuable
when paper punch cards were the standard method
of storing this kind of information. However,
because all stanines are integers, two scores in
a single stanine are sometimes further apart than
two scores in adjacent stanines. This reduces
their value. - Stanine scores are useful in comparing a
student's performance across different content
areas. For example, a 6 in Mathematics and an 8
in Reading generally indicate a meaningful
difference in a student's learning for the two
respective content areas. While stanine scores
are good at signifying broad differences in
performance, they should be used cautiously when
making any finer distinctions about performance.
20
Stanines Defined DescriptivelyNOT RECOMMENDED
- Stanines facilitate using words rather than
numbers in presenting statistical data. Most
people like words, but this practice is arbitrary
and less accurate Bill tested considerably
below average."
21
Pros Cons of Standard Scores
- Strengths
- Wide applicability
- Nice statistical properties
- Teachers often build their narrative reports on
these standard scores using the accepted
descriptive words rather than the numbers. - Weaknesses
- May be hard to explain to laypersons
- Need to know M and SD of original test
- Teachers often build their narrative reports on
these standard scores using the accepted
descriptive words rather than the numbers.
22
Developmental NormsAnother area of real and
potential misuse . . .
- Main examples
- Grade equivalents
- 4.5 Fourth Grade, Fifth Month
- Mental ages (age equivalents)
- 5.10 Fifth Year, Tenth month
- Others stage theories (Piaget), physical
measures (height in relation to age) - Strengths
- Natural interpretation (is this really a
strength?) - Looks at multi-level growth parents / teachers
want - Weaknesses
- Limited to growth functions
- Commonly misused (see next slide)
23
According to Margaret J. Kay, Ed.D. Psychologist
- The practice of using grade equivalency scores to
identify learning disabled children in
educational reports and IEPs is wide spread and
misleading. - The normative data for most tests are usually
collected at one point every year. How, then, are
grade equivalents obtained for every month? They
are extrapolated at the upper and lower ends of
the growth curve. This estimation produces scores
that are systematically too low in the Fall and
too high in the Spring. Problems associated with
this practice are - A high probability of over-identifying learning
disabled children exists if screening is
conducted in the Fall. - A high probability of under-identifying learning
disabled children occurs if screening is
conducted in the Spring.
24
(No Transcript)
25
Norm GroupsTo whom are my students being
compared . . .
- Look for detailed description in test manual to
ascertain the norming group. Might one or a
combination of the following - Users (all previous test takers, e.g. ACT)
- Subgroup (ACT scores achieved by men)
- Local (students in the district)
- Institutional (State)
- National
- International
26
Example National vs. Local NormsSallys score
(the x below) is at the 55th percentile when
compared to National tests takers, but her score
is at the 45th percentile compared to Local test
takers
27
Usefulness of Standardization Group
- To what extent do the norms provide a meaningful
framework? Two issues - Stability
- Usually not a problem because the norms are
developed based on so many cases. - Representativeness
- Compare data on norm group with data on the
target group - Typical variables for comparison
- Age, gender, ability, education, geographic
region, size city, racial/ethnic group,
socioeconomic status
28
Criterion-referenced
- Criterion-referenced refers to the nature of
the interpretation, not the nature of the test. - Requires well-defined content domain.
- Often more complicated than it first sounds.
- Often uses rubrics guides for defining
performance levels. - Ohio likes to use the term Performance Standards
29
Performance Standards
- Outgrowths of standards-based education
- Common terms advanced, proficient, basic
- Each division requires a cut-score
- Cut-scores determined
- By groups of people
- Using one of several different methods
- Determined basically by judgments
- Ohio uses the term benchmark
- the specific component of the knowledge or skill
identified by an academic content, performance or
operational standard.
30
Self-Referencing on Repeated Measures. . . some
call this dynamic assessment . . .. . . has
elements of both norm criterion
- Dynamic assessment is an interactive approach
that embeds intervention within the assessment
procedure. Dynamic assessment is a product of
research by developmental psychologist Lev
Vygotsky. - Main features
- Improved task performance becomes the criterion
for the student Her/His own past performance
constitutes the norm - Simple counts, brief tasks, repeated frequently,
results graphed - Has many potential uses
- Documenting Special Education student progress
- Assessing Basic Skill progress
- Monitoring School Attitude changes
- Also known as CBA "The term curriculum-based
assessment means simply measurement that uses
direct observation and recording of a student's
performance in the local curriculum as a basis
for gathering information to make instructional
decisions" (Deno, 1987). - And also known as CBM (see next slide)
31
Curriculum-Based MeasurementStudent Progress
Monitoring . . .
- Curriculum-Based Measurement (CBM) is a method
teachers use to find out how students are
progressing in basic academic areas while there
is still time to intervene. - CBM can be helpful to teachers and students
because it provides current, week-by-week
information on academic progress. The teacher
using CBM finds out how well a child is
progressing in learning the content for the
academic year in time to modify his/her
instructional strategies. If a students
performance is not meeting expectations, the
teacher then changes the way of teaching to try
to find the type and amount of instruction this
particular student needs to make sufficient
progress toward meeting the academic goals. This
assessment approach allows the student to see
immediate progress and may be more motivational
than punitive tests and quizzes. This powerful
assessment approach can also be shared with
parents to document their childs progress. - See next slide for an example progress chart.
32
- Intervention
33
Closing Thoughts on . . .Dynamic Assessment
Vygotsky
- If we accept Vygotskys view of intellectual
development, we might conclude that it is, in
fact, learning that leads to intellectual
development (as opposed to the other way around). - In Vygotskys view, the standard IQ test only
indicates what a child can achieve on his/her
own. He calls this the level of actual
development. While such a measure is
undoubtedly important, it is also incomplete.
Given appropriate help from an adult, children
can increase their thinking ability. What the
child can achieve with this outside help is
referred to as the level of potential
development. (Vasta, R., Haith, M.M., Miller,
S.A., 1995) - As educators, are we not interested in increasing
this potential rather than labelling and sorting
children based on IQ scores?
34
Practical Advice
- Understand relations among types of norms.
- Be cautious about IQ scores grade equivalents.
- Know the nature of the norm group(s).
- Know what process was used to develop the
performance standards (e.g., benchmarks) in a
criterion-referenced test. - Consider using dynamic assessment as part of your
assessment repertoire.
35
Terms Concepts to Review andStudy on Your Own (1)
- age equivalent
- benchmark
- chronological age
- correction for guessing
- criterion-referenced
- cut-score
- developmental norm
- deviation IQ
- dynamic assessment
36
Terms Concepts to Review andStudy on Your Own (2)
- grade equivalent
- institutional norm
- local norm
- mental age
- narrative report
- national norm
- norm group
- normal curve equivalent
37
Terms Concepts to Review andStudy on Your Own (3)
- normed score
- norm-referenced
- percentage-right score
- percentile
- percentile rank
- performance standards
- ratio IQ
- raw score
38
Terms Concepts to Review andStudy on Your Own (4)
- scaled scores
- standard score
- standardization
- stanine
- subgroup norms
- theta
- T-score
- user norms
Recommended
CrystalGraphics Presentations


