
Quantitative phenotype - PowerPoint PPT Presentation
1 / 45
Title:
Quantitative phenotype
Description:
Quantitative phenotype – PowerPoint PPT presentation
Number of Views:98
Avg rating:3.0/5.0
Title: Quantitative phenotype
1
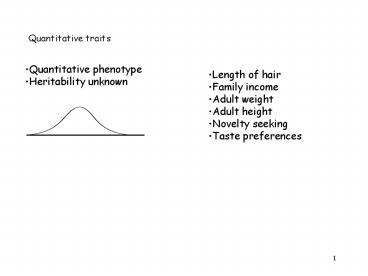
Quantitative traits
- Quantitative phenotype
- Heritability unknown
- Length of hair
- Family income
- Adult weight
- Adult height
- Novelty seeking
- Taste preferences
2
The expected categorical distributions in the F2
if
a 12 unit difference between two inbred parents
is governed by n genes with 1/n effects and the
effect of environment 0.
Charts by R.W. Allard Principles of Plant
Breeding p.87 1960, Wiley and Sons, New York
3
Quantitative traits
12 genes, each of which has 1/12 equal effects No
environmental variance
F2
At F1 meiosis, frequency of the abcdefghijkl
gamete 0.00024 Frequency of the
abcdefghijkl/abcdefghijkl genotype in the F2 1
in 16.6 million
4
The phenotypes of quantitative traits
F2
F2
Many genes All dominant All dominant alleles in
one parent All recessive alleles in the parent No
environmental variance
1 gene Additive effects A allele 1 unit of
phenotype a allele 0 unit of phenotype Some
environmental variance
5
The Genetic Basis of Quantitative Traits
P
F1
F2
F3
E. M. East 1916 Genetics 1 164-176
6
A Thought Experiment
What if metric traits were due n mendelian genes,
each of which has 1/n equal effects? What pattern
of inheritance would you expect?
- Minimize complications
- Inbred parents natural selfers
- One environment
- Parents that are quite different for an easily
measured metric trait - Make these simplifying assumptions
- All of the alleles from one parent have value
1.0 for the trait - All of the alleles from the other parent have
value 0.5 for the trait - None of the genes are linked (no gametic phase
disequilibrium) - All of the alleles combine additively.
7
The Genetic Basis of Quantitative Traits
P
length
6
12
First The parents will show consistently
different means but similar variances when grown
under similar conditions. If the effect of
environment could be reduced to zero, then the
parental variances would collapse to zero.
8
The Genetic Basis of Quantitative Traits
6
12
9
Second The F1 will have the same variance as
the parents when grown under similar conditions.
The mean of the F1 will be at the midpoint of the
parental means.
9
The Genetic Basis of Quantitative Traits
P
6
12
F1
9
F2
9
Third The F2 will show much greater variance
than the F1 or the parents when grown under
similar conditions. The mean of the F2 will equal
the mean of the F1.
10
The Genetic Basis of Quantitative Traits
P
F1
F2
F3
Fourth Different F2 individuals will produce
progeny with different variances. Fifth In
generations succeeding the F2 the variance of a
family can be the same or less than that of the
family from which it came, but not greater.
11
The Genetic Basis of Quantitative Traits Corolla
length in Nicotiana longiflora
P
Length (mm)
40
93
First The parents show consistently different
means but similar variances when grown under
similar conditions.
corolla
E. M. East 1916 Genetics 1 164-176
12
The Genetic Basis of Quantitative Traits Corolla
length in Nicotiana longiflora
40
93
63
Second The F1 variance was similar to that of
the parents when grown under similar conditions.
The mean of the F1 was close to the midpoint of
the parental means.
13
The Genetic Basis of Quantitative Traits Corolla
length in Nicotiana longiflora
P
40
93
F1
63
F2
68
Third The F2 showed much greater variance than
the F1 or the parents when grown under similar
conditions. The mean of the F2 was similar to the
mean of the F1.
14
The Genetic Basis of Quantitative Traits Corolla
length in Nicotiana longiflora
P
F1
F2
F3
Fourth Different F2 individuals did produce
progeny with different variances. Fifth In
generations succeeding the F2 the variance of a
family was the same or less than that of the
family from which it came, but not greater.
15
Frequency distributions for corolla length in the
parents, F1, and F2 generations in a cross
between different varieties of Nicotiana
longiflora.
Data shown were taken from E. M. East 1916
Genetics 1 164-176. Chart by R.W. Allard
Principles of Plant Breeding p.81 1960, Wiley
and Sons, New York
16
Line cross QTL mapping
Cross two inbred lines having phenotype of
interest Creates linkage disequilibrium (LD) in
the F2 progeny Use LD to find markers associated
with QTL
17
QTL detection
Mean(AA)
Mean(aa)
Mean(Aa)
Mean(MM)
Mean(mm)
Mean(Mm)
If the QTL is at the locus M (locus A and locus M
are the same), then the phenotypic means of the
individuals having the genotypes MM,Mm and mm
might be different.
18
The Norm of Reaction and Phenotypic Distribution
Genotype aa
The transformation of an environmental
distribution into a phenotypic distribution
19
Genotypes and Phenotypic Distributions
Environment 2
Environment 1
- A population may consist of mixtures of genotypes
- The shape of the distribution function depends on
the mean and variance of the trait for all the
genotypes within it.
20
The Norm of Reaction with Two Genotypes
Height
100 cm
aa
AA
AA
Genotype AA
aa
Genotype aa
30C
20C
21
Maize Dwarf Mosaic Virus
Norm of reaction Temperature Water Number of
innoculations Age of plant when innoculated Titer
of innoculum
22
Statistical model of QTL variation
- The phenotype Y the effect of genotype G plus
the effect of environment E - The phenotypic variance Y can be partitioned into
genetic and environmental components - For the trait affected by a single gene Q
- The genotypic value of an individual with
genotype QuQv can be partitioned thus - The mean ? of the phenotype for that individual
- The additive effect of au of the allele Qu
- The additive effect of av of the allele Qv
- The dominance effect duv
23
Hypotheses in QTL mapping
- Ho There is no QTL anywhere
- Ho There is a QTL but not here (not linked to
the tested position) - HA A QTL is present and the QTL is linked to the
tested position
Marker 1
Marker 2
AA
aa
Aa
bb
Bb
BB
24
The test statistic t
BC1
Mean(aa)
Mean(Aa)
Mean(mm)
Mean(Mm)
HoThe phenotypic means of the genotypic classes
are equal. H1The phenotypic means of the
genotypic classes are not equal.
25
Single -marker analysis (Single factor
ANOVA) Each marker examined separately No
attention given to map distances
- Let QTL A be at DNA marker M
- Calculate phenotypic means for
- MM genotypes
- Mm genotypes
- mm genotypes
- Do ANOVA
- If F test is significant, conclude a QTL exists
Mean(AA)
Mean(aa)
Mean(Aa)
Mean(MM)
Mean(mm)
Mean(Mm)
26
QTL mapping methods no genetic map required
- Single-locus mapping
- Tests the association between trait values and
the genotypes of marker loci one by one - A significant association indicates the presence
of a QTL linked to the marker. - t test, F test, R2
- Multiple Regression
- Tests the association between trait values and
the genotypes of marker loci in groups - A significant association indicates that subset
that best explains the observed phenotypic
variance - F test, Cp, R2
27
QTL mapping methods genetic map required
- Interval mapping (IM)
- Evaluates the association between the trait
values and the expected genotype of a
hypothetical QTL between pairs of adjacent marker
loci - The expected QTL genotype is estimated from the
genotypes of the flanking marker loci and their
distance from the QTL. - The analysis point that yields the most
significant association indicates the most likely
position of a putative QTL. - Composite interval mapping (CIM) or multiple QTL
mapping (MQM) - Evaluates the association between the trait
values and the expected genotype of a
hypothetical QTL between pairs of adjacent marker
loci - Includes in the analysis the effect of one or
more background markers elsewhere in the genome. - Background markers are detected by multiple
regression prior to CIM
28
MDMV An Early Success
- F2F3 design
- 94 F3 families, 96 RFLP markers
- 5 QTL mapped for MDMV
- Progeny test confirmed QTL
- R2 0.90
- MDMV resistant hybrid
29
Mapping QTL for ECB2(resistance to European corn
borer. 2nd generation)
- 200 RIL
- No genetic variance within lines
- 121 DNA markers
- 7 locations
- 3 years
30
Results A lot of different QTL
- Only two locations across three years
- GLM procedures indicated high GxE
5
4
5
7
6
7
0.6
0.4
R2
Loc 1
0.2
Loc 2
0
Y1
Y2
Y3
31
What Happened?
- Nongenetic variance
- 500 year floods
- ECB disease
- Genetic variance
- GxE
- GxG
- Sample size
32
The Beavis Effect
- When the sample size n is small and the
number of small effect QTL is large, then number
of QTL detected becomes a function of n.
33
The many small effect QTL universe
?
?
?
?
?
?
?
?
?
?
?
?
?
?
?
?
?
?
?
?
?
?
?
?
?
?
?
?
?
?
?
?
?
?
?
?
?
?
?
?
?
?
?
?
?
?
?
?
?
?
?
?
?
?
?
?
?
?
?
?
?
?
?
?
?
?
?
?
?
?
?
?
?
?
?
?
?
?
?
?
?
?
?
?
?
?
?
?
?
?
?
?
?
?
?
?
?
?
?
?
?
?
?
?
?
?
?
?
?
?
?
34
The effect of sample size, heritability and QTL
number on QTL detection
100
90
80
30
70
10
Hits
63
60
95
50
30
40
40
63
30
95
20
10
0
100
500
1000
Sample Size
35
Simulation Summary
- Small sample sizes underestimate QTL number
- Estimated genetic effect/QTL has upward bias
- False positives are rare
36
QTL mapping in Natural Populations
Fusiform rust in pines Pitch Canker in
pines Sudden oak death in oaks and tan oaks
37
Uninformative parents in outbred populations
Heterozygous for the QTL but not the marker
Heterozygous for the marker but not the QTL
Fully informative Heterozygous for both
38
Linkage phase differences in different sets of
relatives
Set I parents
Set II parents
The same QTL A, the same marker M, but different
linkage phases
39
QTL mapping by marker changes in
populationsSelectable obligate outcrossers
- Subject a base population to divergent selection
- Test for significant changes in marker allele
frequencies between up and down selected lines
40
Selection strategies enrich parent populations
for the QTL A and B
Refractory population
Susceptible population
but recombination will erode linkage
disequilibrium between the QTL and the markers
41
Requirements for QTL detection by changes in
allele frequencies
- A densely populated linkage map
- Tight linkage between the QTL and marker is
necessary to permit detection of a change in
allele frequency - A trait in which a few QTL of large effect are
more likely than many small effect QTL - Selection acts more quickly on large effects, so
a change in allele frequencies of markers may be
observed before recombination can undo the
association - A large population from a small one
42
Candidate Genes
Mean(AA)
Mean(aa)
Mean(Aa)
Mean(MM)
Mean(mm)
Mean(Mm)
In the candidate gene approach, the hypothesis is
that the QTL and the marker are the same.
43
Problems with the candidate gene approach
Finding the candidate
- Brute force DNA sequencing
- Find all the open reading frames (ORFs)
- Locate all potential alleles in the ORFs
- Do fine scale LD mapping on every allele
- Knock outs
- Select a potential candidate gene
- Generate mutants in which the gene is disabled
- Examine the phenotype for effect
- Usually a lot more than just the of gene of
interest is affected by this strategy - Association tests
44
More problems with the candidate gene approach
- The candidate gene may be a neutral marker
tightly linked to a QTL - Association studies may be biased by population
stratification - Population stratification
- The sample population consists of a mixture of
divergent subpopulations with different candidate
gene frequencies and different frequencies of
affected individuals
45
Association does not imply causation
- Other reasons for false or misleading
associations - Incorrectly designated subpopulation
(misclassification) - Failure to understand the reaction norm for the
trait - Failure to establish a genetic basis for the trait
Recommended
CrystalGraphics Presentations


