
MTH 5102 Pretest C - PowerPoint PPT Presentation
1 / 8
Title:
MTH 5102 Pretest C
Description:
2. Knowing that the arithmetic mean of a group in astronomy is 83% with a ... a Z-score of 2, which class (Pascal's or Isabelle's) obtained the highest mean? ... – PowerPoint PPT presentation
Number of Views:109
Avg rating:3.0/5.0
Title: MTH 5102 Pretest C
1
MTH 5102 Pretest C
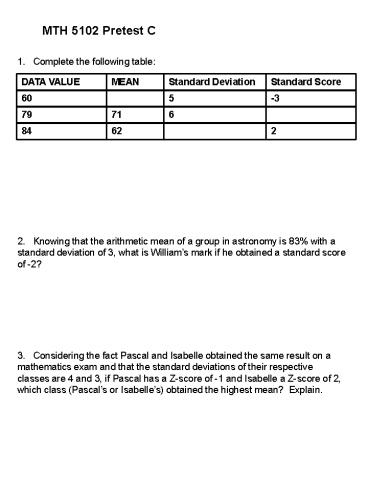
1. Complete the following table
2. Knowing that the arithmetic mean of a group
in astronomy is 83 with a standard deviation of
3, what is Williams mark if he obtained a
standard score of -2?
3. Considering the fact Pascal and Isabelle
obtained the same result on a mathematics exam
and that the standard deviations of their
respective classes are 4 and 3, if Pascal has a
Z-score of -1 and Isabelle a Z-score of 2, which
class (Pascals or Isabelles) obtained the
highest mean? Explain.
2
4. Ludovic obtained a result of 16/20 on a
History test and another of 15/20 in French. In
History, the groups mean is 13.5/20 and in
French 12/20. The standard deviation for the
History class is higher that that of the French
class. For which subject did Ludovic have the
best performance compared to the remainder of the
class?
- Two javelin throwers record their daily best over
a 10 day period as they train for a competition.
The results are in the table below. - Which athlete is better prepared for the
competition? Explain.
- All students from adult education are submitted
to a general knowledge test. To do so, they are
separated into 6 groups with each group receiving
a different test. After the test, the director
wants to give a special award to the best
performance.
What group will the award winner come from?
3
- Match each scatter plot to its corresponding
correlation correlation coefficient.
- Identify the direction (positive or negative) and
the degree of the correlation characterizing the
following statements. - A) A persons annual salary and the length of
his nose. - B) The distance traveled by a car and the
amount of gas left in his tank. - C) The number of practice hours for a driving
exam and the result obtained for this exam. - D) The link between the number of nice weather
days and the amount of precipitation each year. - E) The number of hours worked per weak and the
salary of a person.
4
- Use the rectangular method to estimate the value
of the correlation coefficient for the following
scatter plot.
Ages of couples from Beauport
5
10. Considering the following scatter plot and
the following means
a) Determine the equation of the regression line
for this distribution from the scatter plot.
b) Use the equation of the regression line to
determine the result a student got in his retake
if he got 51 on his original exam.
6
11. The following table presents the best
rookies in the history of the NBA. Give the
degree and justify the correlation that exists
between the age of a player during his first year
and the average points scored per game by that
player during that year.
7
12. The following table shows the demographic
projections of the UN concerning the population,
fertility rate and the percentage that is over 60
years old for certain countries according to a
estimate in the year 2000 .
For the Population (y) and Fertility Rate (x)
r 0.5083 and y 400.3845x 424.4044
For the Population (y) and Percentage over 60
years old (x) r -0.6437 and y
-43.8003x 1049.7626
a) In order to get the best estimation of the
population, which of the above two models would
be preferable to use? Why? b) Determine the
fertility rate for Spain which has a population
of 40 000 000 inhabitants. c) Determine
Swedens population given that 18.3 of its
population is over 60 years old.
8
13. Below is a table expressing the number of
alcoholic drinks a 70 kg man consumes and the
number of mg of alcohol detected in a blood
sample at a given time after..
- What is the correlation coefficient between these
2 variables? - Determine the equation of the regression line.
- Can you assert that a prediction made using this
line is reliable? - If this tendency continues, how many mg of
alcohol will be in a blood sample after 12 drinks?
14. The UN compares life expectancy for several
countries in the year 2000 with the projections
for the year 2050 in the following table.
Life Expectancy
- Does a statistic relationship exist between the
life expectancy in a country for the year 2000 to
that in the year 2050? If so, qualify it? - Is the following table interesting for a
statistician? Why?
Recommended
CrystalGraphics Presentations


