
Scan, Analyze - PowerPoint PPT Presentation
1 / 35
Title:
Scan, Analyze
Description:
Stagflation - a combination of prosperity & recession (affluence and low incomes) ... Economy is moving out of recession or depression towards prosperity. Recovery ... – PowerPoint PPT presentation
Number of Views:84
Avg rating:3.0/5.0
Title: Scan, Analyze
1
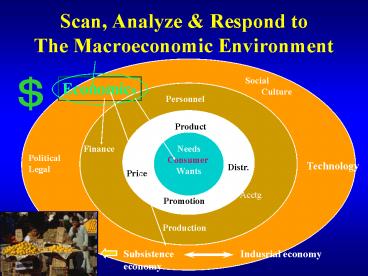
Scan, Analyze Respond to The
Macroeconomic Environment
Social Culture
Economics
Personnel
Product
Needs Consumer Wants
Finance
Political Legal
Technology
Distr.
Price
Acctg
Promotion
Production
Subsistence Indusrial
economy economy
2
Business Cycle
Macroeconomic trends Influence the Companys
Marketing Mix
Prosperity
Recovery
Depression
Recession
- Stagflation - a combination of prosperity
recession (affluence and low incomes)
3
The Business Cycle
- The U.S. economy created 2.2 million jobs in
2004, reversing the 2.3 million jobs lost from
Dec. 2000 to Dec. 2002.
4
Business Cycle, a pattern of economic
fluctuations
- Willingness to buy (Spend) is influenced by
expected product satisfaction, the ability to buy
and numerous psychological and social forces such
as expectations based on general economic
conditions - Employment security, family size, mobility,
education, .
5
ECONOMIC ENVIRONMENT (Prosperity..Recession)
ORGANIZATIONAL MARKETING STRATEGY Product,
Price Promotion Phys. Distr..
CONSUMER EXPECTATIONS Purchasing power
patterns Job Security, Product Prices
MARKETING MANAGER DECISIONS - Risk Level -
Capital Expenditures - New Product Creation
6
Consumer Confidence Index(Expectations, A Lag
Effect Variable)
1 Source WSJ, 16Oct.2002,pg.A17 (Conference
Board)
7
American Customer Satisfaction Index
Source American Customer Satisfaction Index,
University of Michigan Business School, Nov.
2003, http//www.theacsi.com/April 2004.
8
Economic Trends Top Nations BY GNP (GDP)
US GDP 12,487 trillion (31Dec2005) 11,134
Trillion in 2000 . (bea.gov xxxx
accessed15july06)
9
Canada
Japan
E.U.-3
U.K.
10
Euro Zone Changes the World Market
- of World of World Stock Market
- Population GDP Trade
Capitalization - Euro-11 290 million 19 19
4 trillion - ..
- U.S. 270 million 20 17
11 trillion - 1998 estimates
11
Income Varies by States (2005 dollars)
- Median Family Income
- 1 Connecticut 75,541
- 2 New Jersey 75,311
- 21 Pennsylvania 55,904
- 50 Mississippi 37,791
- United States 55,832
Median Household Income 1 New Jersey
61,672 2 Maryland 61,592 25
Pennsylvania 44,537 50 Mississippi
32,938 United States 46,242
12
Median Household IncomeVaries by Counties (2005)
- 1 Loudon County, Va. 98,500
- Fairfax County, Va. 94,600
- Howard County, Md. 91,200
- Somerset County, NJ 88,500
- 5 Morris County, NJ 84,000
- Orleans Parish, La. 30,700
- Bronx County, NY 29,200
- Hildago County, Tx 24,500
Top 5
Bottom 3
Sales Marketing Management, produces Effective
Buying Income data by metro-area (county/city)
13
Consumer Income
- Gross National Product (all) (GDP USA only)
- Depreciation
Net Natl Product
- Soc.Sec., Corp.taxes,etc.
- Personal Income - direct taxes
- Disposable Income - essential
expenses 1973- 1100 Conn. ave, 300 College
Park, Md. - Discretionary Income
Civilian Labor Force 146.5 mil., 2005 6.9
unempl
14
Purchasing Power
- Buying power.All resources (money, goods and
services) that can be traded (exchanged) for
products - Inflation ....Decrease in buying power due to
decrease in real income (deflation) - Real income .... change in income relative to
change in cost of goods services - HIGH COST OF LIVING or
COST OF LIVING HIGH ?
15
Borrowed Time
(In Trillions)
Clements, Jonathan. Getting Going. WSJ, June 6,
2003
16
Growth in Consumer Credit
17
The Macro Economic Environment
- Hyper competition --- mergers and acquisitions
to acquire economies of scale (manufacturing,
Distr.., Promotion, etc.) - Equitable income distribution rich/poor
income mobility
Top2050 of income, bottom 60 28 of income
2005
Wealth- access to all assets, income ,credit,etc.
Consumer purchases 75 income, 25 wealth
effect (1999)
18
Controversy Over the Cost of Filling UpNominal
(actual price) vs. real (inflation-adjusted)
average
annual prices per gallon
2.00
1.50
(Nominal)
1.00
0.50
(Real Income)
0
1960
65
70
75
80
85
90
95
19
Consumer Price Indexes
- (1982-1984 100) Index
- ALL items (3/31/01) 176.2
- Minus food energy 185.3 New York
186.4
Boston
190
Dallas - Food and beverages
172 - Medical Care
270 - Housing
175 - Entertainment
104 - Apparel 132
- Transportation
154 - Education
?
WSJ,18April01,A2
20
U.S. Standard of Living
- 1978 1997
- Households with 7 rooms 22 29
- with 4 rooms 35
30 - Central Air Midwest 25
51 - South
37 70 - Microwave 8
83 - Dishwasher 35
50 - Clothes Dryer 59
71 - Licensed Driver Avg. Travel mi. 9,700
13,000
21
The Macroenvironment
- Key Economic Trends
- U.S. income distribution is skewed.
- Upper class, middle class, working class,
underclass - Rich getting richer Middle class shrinking
Underclass still poor - Consumer spending patterns are changing.
22
Wal-Mart Region Enjoys Boom, but Not All
Benefit, (WSJ,10Feb05)
23
Household Income Taxes
Federal Taxes
Total Income
TOP
.1
17.4
9.1
1
19
36.9
5
57.1
33.4
Top 50
86.6
96.7
Bottom 50
3.3
96.7
IRS 2006 data in WSJ, 2-3Sept2006,A8
24
USA Boom and Bust
Clements, Jonathan. Getting Going. WSJ, D1,
July 9, 2003
25
Wealth Vs.IncomeAmericas Wealth...A More Even
Scale
Wealth effect -- as stocks gain, spending
increases (w/less savings)
26
(No Transcript)
27
Japanese Savers,U.S. Spenders
- Net household saving rates
Source Commerce Dept.s Bureau of Economic
Analysis
28
Spenders and Savers as a Percentage of Total
Population 1965 to 2025
LO3
40
35
Spenders ( Age 20 to 44)
30
Percent
25
Savers ( Age 45 to 64)
20
15
1965 1970 1975 1980 1985
1990 1995 2000 2005 2010
2015 2020 2025
Year
SOURCE Based on data from U.S. Bureau of the
Census, Population Paper Listings PPL. 41,
Current Population Reports P25-1130, U.S. Census
of Population (1970), volume 1, Part B, Census of
Population (1980) volume 1, part B.
29
Dual Wage Earners and Their Effect on Hours Spent
Shopping
Dual incomes rose ...
200
12
8
Families with Dual Incomes (1965 - 100)
Shopping Hours per
Month
and shopping hours dropped
4
100
0
1965 1980
1995 Year
SOURCE Vision for the New Millennium . .
.(Atlanta Kurt Salmon Associates, 1997). Used
with permission
30
ENGELS LAW(S)(General Propositions)
- As Family income increases, the proportion spent
on food decreases - As family income increases, the proportion spent
on clothing remains nearly the same. - Context Changes in income must be related to
TIME. - Marketing Implication There are patterns to
consumer expenditures. Patterns do not change
much over time.
31
Your Financial Game Plan
- Housing 25-40
- Food 10-29
- Transportation 10-20
- Clothing upkeep 7-13
- Saving Insurance 8-20
- Gifts contribution 1-6
- Medical dental 1-6
- Recreation, vacation 3-10
- Miscellaneous 1-10
32
Changing Purchasing Habits of American Households
25
Medical
20
15
Food
Percent
10
Recreation
5
Clothing
0
1970 1980 1990
2004
Year
SOURCE Vision for the New Millennium . .
.(Atlanta Kurt Salmon Associates, 1997). Used
with permission
33
Manufacturing Jobs
Applied Economics
Ansberry, Clare. Why U.S. Manufacturing Wont
Die. WSJ, B1, July 3, 2003
34
Manufacturing
- Of 17 million jobs left in the US manufacturing
sector, 52 are involved in the actual production
of goods. - A decade ago, 68 of mfgr. jobs were involved
in the actual production (factory floor).
- Pros Making a good generally has a greater
impact on the economy than providing a service.
- Cons An indirect risk is less innovation caused
by manufacturing sector morphing into the service
sector. - Manufacturing led to innovations in software,
- cancer screening, as well as Teflon and drip
coffee makers.
35
Average Manufacturing Sector Wages in U.S. Dollars
Rhoads, Christopher. Burden of History. WSJ,
A1, December 6, 2002
Recommended
CrystalGraphics Presentations


