
Gas Exchange in Plants - PowerPoint PPT Presentation
1 / 30
Title: Gas Exchange in Plants
1
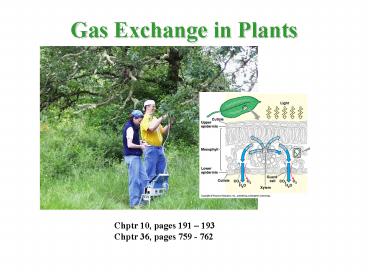
Gas Exchange in Plants
Chptr 10, pages 191 193 Chptr 36, pages 759 -
762
2
Diffusion in media
- Movement along concentration gradients
- Gases diffuse faster in atmosphere than water
- Rate of diffusion dependent on square root of the
mass of molecule H2O diffuses 1.56 times CO2
3
Crossing barriers
- Surfaces must be moist
- Concentration gradient must be present
- Short pathway important for rapid exchange
4
Tradeoffs
- Selectivity does not occur
- Enhancing the exchange rate of one gas enhances
exchange of another gas unless change in
concentration gradients occur
5
Exchange pathways
- Cuticle
- stomata
6
Leaf epidermis with stomata
7
Stomate structure
8
Distribution of Stomata
- Amphistomatous - both surfaces
- Epistomatous - upper surface
- Hypostomatous - lower surface
- No stomata
9
Size of stomata
- Width 3 12 ?
- Length 10 40 ?
- Density 1,000 60,000 cm2
- Total opening per leaf surface consistently 1-2
10
Boundary layer structure and relationship to
leaf size
gtot (gleaf x gbl)/(gleaf gbl)
gbl 1/rbl
rbl blmm/Dj
blmm 4 x ?(Lm/Vms-1)
11
Gas Flux in Leaves
- FluxH2O (H2Oin - H2Oout)/rtot
- FluxCO2 (CO2in - CO2out)/rtot
- rtot rbl rs
- Thus fluxgas (gasin - gasout)/(rbl rs)
- When stomata just open, rs is large relative to
rbl and increase in flux is linear. - When somata near wide open, rs is small relative
to rbl (constant) and flux levels off.
12
Change in flux with increasing stomatal aperture
flux
0
incr
1/rs
13
Effect of leaf size on gas exchange
14
Acacia koa leaves
15
Effect of leaf width on boundary layer and
comparison of conductance in juvenile leaves
versus phyllodes
blmm 4 x ?(Lm/Vms-1)
16
Photosynthesis in phyllodes versus juvenile
leaves and effect of light intensity on
photosynthesis
17
Water relations in guard cells runs counter to
water relations in adjacent cells
18
Water potential dynamics of stomata
19
Fig. 36.13
20
Factors affecting stomatal operation
- Light
- CO2
- Humidity
- Temperature
- Abscisic acid
21
Gas exchange efficiencies
- Water use efficiency (WUE)
- CO2 gained (A)/water lost (E) - Quantum Efficiency (QE)
- CO2 gained (A)/photon absorbed (Q)
22
Measuring WUE
- Spot measurements of CO2 uptake and water loss
- Long term using C13/C12 ratios in plant material
- RuBP discriminates against C13 in favor of C12.
- When Ci is high (open stomata, low WUE), C13/C12
is lower in sugars and products. - When Ci is low (more closed stomata, high WUE),
C13/C12 is higher in sugars and products.
23
Modifying WUE
- WUE CO2 gained/H2O lost
- Since the resistances for both are similar, WUE
can be approximated by (CO2in -
CO2out)/(H2Oin - H2Oout) - To increase WUE, either CO2 gradient must be
increased or H2O gradient decreased. - The gradient for water loss is dictated by the
environment, since plant is close to saturation. - Atmospheric carbon CO2out is constant, thus
plant can only increase WUE by increasing its
affinity for CO2 and decreasing internal CO2in
thus increasing driving force for uptake.
24
Calvin-Benson cycle - C3
RuBP requires gt50ppm CO2
RuBP can combine with O2 leading to
photo- respiration and depression of Ps at high
light intensities.
Fig. 10.17
25
Hatch and Slack pathwayC4
PEP requires lt10 ppm CO2 and does not combine
with O2.
O2 present in low amounts in bundle sheath
cells.
Fig. 10.18
26
Internal Anatomy of C3 and C4 leaves
C3 leaf
C4 leaf
27
Crassulacean Acid MetabolismCAM
Fig. 10.19
28
Changes in internal conditions forCAM over 24
hrs.
29
Comparison of Photosynthetic pathways
30
The End
Recommended
CrystalGraphics Presentations


