
GoodnessofFit Tests and Contingency Analysis - PowerPoint PPT Presentation
1 / 43
Title:
GoodnessofFit Tests and Contingency Analysis
Description:
Example: Finger Lakes Homes (A) Multinomial Distribution Goodness of Fit Test. Finger Lakes Homes manufactures. four models of prefabricated homes, ... – PowerPoint PPT presentation
Number of Views:118
Avg rating:3.0/5.0
Title: GoodnessofFit Tests and Contingency Analysis
1
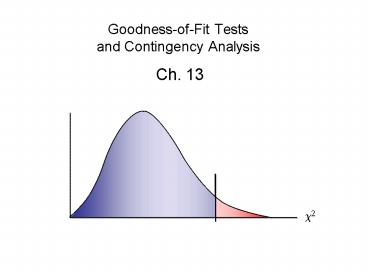
Goodness-of-Fit Testsand Contingency Analysis
- Ch. 13
?2
2
Hypothesis (Goodness of Fit) Testfor Proportions
of a Multinomial Population
Multinomial Population a single population
consisting of more than one category.
3
Example Finger Lakes Homes (A)
- Multinomial Distribution Goodness of Fit Test
- Finger Lakes Homes manufactures
- four models of prefabricated homes,
- a two-story colonial, a log cabin, a
- split-level, and an A-frame. To help
- in production planning, management
- would like to determine if previous
- customer purchases indicate that there is
- a preference in the style selected.
4
Hypothesis (Goodness of Fit) Testfor Proportions
of a Multinomial Population
Multinomial Population a single population
consisting of more than one category.
1. Set up the null and alternative hypotheses.
2. Select a random sample and record the
observed frequency, oi , for each of the k
categories.
3. Assuming H0 is true, compute the expected
frequency, ei , in each category by
multiplying the category probability by the
sample size.
5
Hypothesis (Goodness of Fit) Testfor Proportions
of a Multinomial Population
4. Compute the value of the test statistic.
6
Example Finger Lakes Homes (A)
- Multinomial Distribution Goodness of Fit Test
- Finger Lakes Homes manufactures
- four models of prefabricated homes,
- a two-story colonial, a log cabin, a
- split-level, and an A-frame. To help
- in production planning, management
- would like to determine if previous
- customer purchases indicate that there is
- a preference in the style selected.
7
Multinomial Distribution Goodness of Fit Test
- Hypotheses
H0 ?C ?L ?S ?A .25 HA The population
proportions are not as stated above
where ?C population proportion that purchase
a colonial ?L population proportion that
purchase a log cabin ?S population proportion
that purchase a split-level ?A population
proportion that purchase an A-frame
8
Example Finger Lakes Homes (A)
- Multinomial Distribution Goodness of Fit Test
- The number of homes sold of each
- model for 100 sales over the past two
- years is shown below.
Split-
A- Model Colonial Log Level Frame
Sold 30 20 35 15
9
Multinomial Distribution Goodness of Fit Test
10
Multinomial Distribution Goodness of Fit Test
- Rejection Rule
Reject H0 if c2 7.815.
With ? .05 and k - 1 4 - 1 3
degrees of freedom
Do Not Reject H0
Reject H0
?2
7.815
11
Multinomial Distribution Goodness of Fit Test
- Conclusion
c2 10 7.815
We reject, at the .05 level of
significance, the assumption that there is no
home style preference.
12
Now You Try
- In the brochure Colors made available by
MM/MARS, maker of MM chocolate candies, the
traditional distribution of colors for the plain
candies is said to be as follows - In a follow-up study, 1-lb. bags were used to
determine whether the represented percentages
were valid. The following results were obtained
for a sample of 506 candies.
13
Now You Try
- Use ? .05 to determine whether the observed
data support the percentages reported by the
company.
H0 ?Br .30, ?Y .20, ?R .20, ?O .10, ?G
.10, ?Bl .10 HA The population proportions
are not as stated above
14
Now You Try
15
Now You Try
- ?2.05 11.070 (5 degrees of freedom)
- 29.51 11.070 ? Reject H0
- The percentages reported by the company have
changed.
16
Test of Independence
- Uses the chi-square distribution to test for the
independence of two variables
17
Example Albers Brewery
- Contingency Table (Independence) Test
- Albers produces 3 types of beer light,
regular, and dark. To help in the development of
a new advertising campaign, the firm would like
to know whether preferences for the 3 beers
differ among male and female beer drinkers. - A test of independence addresses the question
of whether the beer preference (light, regular,
or dark) is independent of the gender of the
drinker (male, female).
18
Test of Independence Contingency Tables
1. Set up the null and alternative hypotheses.
2. Select a random sample and record the
observed frequency, oij , for each cell of
the contingency table.
3. Compute the expected frequency, eij , for
each cell.
19
Test of Independence Contingency Tables
4. Compute the test statistic.
20
Example Albers Brewery
- Contingency Table (Independence) Test
- Albers produces 3 types of beer light,
regular, and dark. To help in the development of
a new advertising campaign, the firm would like
to know whether preferences for the 3 beers
differ among male and female beer drinkers. - A test of independence addresses the question
of whether the beer preference (light, regular,
or dark) is independent of the gender of the
drinker (male, female).
21
Test of Independence Contingency Tables
Using sample data to test for the independence of
two variables
1. Set up the null and alternative hypotheses.
2. Select a random sample and record the
observed frequency, oij , for each cell of
the contingency table.
22
Contingency Table (Independence) Test
- Hypotheses
H0 Beer preference is independent of gender HA
Beer preference is not independent of gender
- Contingency Table
Beer Preference
23
Contingency Table (Independence) Test
A simple random sample of 150 is selected. After
tasting each beer, the individuals state their
preference. The sample results (observed
frequencies) are described below
24
Test of Independence Contingency Tables
Using sample data to test for the independence of
two variables
1. Set up the null and alternative hypotheses.
2. Select a random sample and record the
observed frequency, oij , for each cell of
the contingency table.
3. Compute the expected frequency, eij , for
each cell.
25
Expected Frequencies
26
Expected Frequencies
27
Expected Frequencies
28
Expected Frequencies
Expected Frequencies
29
Test of Independence Contingency Tables
Using sample data to test for the independence of
two variables
1. Set up the null and alternative hypotheses.
2. Select a random sample and record the
observed frequency, oij , for each cell of
the contingency table.
3. Compute the expected frequency, eij , for
each cell.
4. Compute the test statistic.
30
Computation of the ?2 Test Statistic
?2
31
Test of Independence Contingency Tables
Using sample data to test for the independence of
two variables
1. Set up the null and alternative hypotheses.
2. Select a random sample and record the
observed frequency, oij , for each cell of
the contingency table.
3. Compute the expected frequency, eij , for
each cell.
4. Compute the test statistic.
32
Contingency Table (Independence) Test
- Rejection Rule
- Conclusion
Reject H0 if ?2 5.99
Beer preference is NOT independent of the gender
of the drinker
33
(No Transcript)
34
(No Transcript)
35
(No Transcript)
36
(No Transcript)
37
(No Transcript)
38
Now You Try
- In a study of brand loyalty in the automotive
industry, new-car customers were asked whether
the make of their new car was the same as the
make of their previous car. The breakdown of 600
responses shows the brand loyalty for domestic,
European, and Asian cars.
39
Now You Try
- Conduct a hypothesis test to determine whether
brand loyalty is independent of the make of the
car. Use ? .05. What is your conclusion? - Observed Frequency (oij)
40
Now You Try
- Expected Frequency (eij)
41
Computation of the ?2 Test Statistic
42
Now You Try
- Conclusion
43
End of Chapter 13
Recommended
CrystalGraphics Presentations


