
Fig 1: Experimental Setup - PowerPoint PPT Presentation
1 / 8
Title:
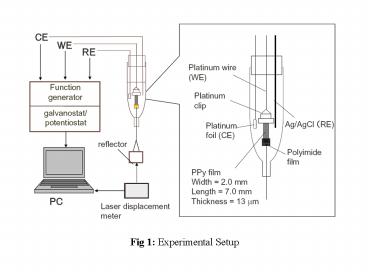
Fig 1: Experimental Setup
Description:
Numerical in circle is sequential of measurement. Fig.4. ... Fig. 8 Energy conversion efficiency against load stress in various electrolytes. ... – PowerPoint PPT presentation
Number of Views:59
Avg rating:3.0/5.0
Title: Fig 1: Experimental Setup
1
Fig 1 Experimental Setup
2
Fig.2 Rectangular wave forms of applied voltage
to PPy/CF3SO3 film at -0.7 to 0.3 V vs. Ag/AgCl
with the period of 600s.
3
Fig. 3 Load dependence of ECMD in PPy/CF3SO3 film
operatedin aqueous 0.1M NH4PF6. Numerical in
circle is sequential of measurement.
4
Fig.4. Current responses in ECMD of the film at
various load stresses, (a) Oxidation (elongation)
and (b) Reduction (contraction).
5
Fig.5 Load stress dependence of electrical input
energies EEin.
6
Fig. 6 Electrochemomechanical strain stress
curves in PPy/CF3SO3 film. Dotted line is
obtained by equation (1), with the parameter of
e0 7.0 and E 0.21GPa.
7
Fig.7 Stress dependence of mechanical output
energy, EMout of PPy film operated in various
electrolytes.
8
Fig. 8 Energy conversion efficiency against load
stress in various electrolytes.