
Mie Code - PowerPoint PPT Presentation
1 / 1
Title:
Mie Code
Description:
The inputs for the code are: Table 2. Mie code input parameters and values. ... distribution (PSD) based on an inversion of the volume scattering function (VSF) ... – PowerPoint PPT presentation
Number of Views:82
Avg rating:3.0/5.0
Title: Mie Code
1
- Mie Code
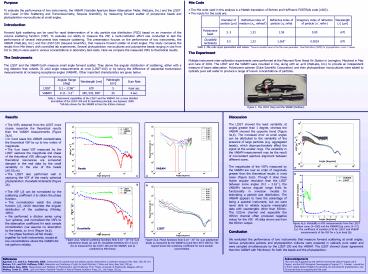
- The Mie code used in this analysis is a Matlab
translation of Bohren and Huffmans FORTRAN code
(1983). - The inputs for the code are
- Table 2. Mie code input parameters and values.
Second variable name is the Mie code parameter.
See MacCallum (2000) for phytoplankton n and n
values - The Experiment
- Multiple instrument inter-calibration experiments
were performed at the Patuxent River Naval Air
Station in Lexington, Maryland in May and June of
2002. The LISST and the VABAM were mounted in
line, along with an ac-9 (WetLabs, Inc.) to
provide an independent measure of beam
attenuation. Polystyrene spheres (Duke Scientific
Corporation) and then phytoplankton monocultures
were added to optically pure salt water to
produce a range of known concentrations of
particles.
Purpose To evaluate the performance of two
instruments, the VABAM (Variable Aperture Beam
Attenuation Meter, WetLabs, Inc.) and the
LISST-100 (Laser In-Situ Scattering and
Transmissiometry, Sequoia Scientific), by
measuring forward scatter of polystyrene beads
and phytoplankton monocultures at small
angles. Introduction Forward light scattering
can be used for rapid determination of in situ
particle size distribution (PSD) based on an
inversion of the volume scattering function
(VSF). To evaluate our ability to measure the
VSF, a multi-institution effort was conducted to
test the performance of several instruments that
measure scattering. This presentation focuses on
the performance of two instruments, the VABAM
(WetLabs, Inc.) and the LISST-100 (Sequoia
Scientific), that measure forward scatter at
small angles. This study compares the results
from Mie theory with controlled lab experiments.
Several phytoplankton monocultures and
polystyrene beads ranging in size from 0.6 to
160mm were used in various concentrations in
laboratory tank tests. Here we compare the
measured VSFs to theoretical results. The
Instruments The LISST and the VABAM both measure
small angle forward scatter. They derive the
angular distribution of scattering, either with a
ring detector that collects 32 solid angle
measurements at once (LISST-100) or by taking the
difference of sequential transmission
measurements at increasing acceptance angles
(VABAM). Other important characteristics are
given below. Table 1. Instrument
capabilities of the LISST and the VABAM. For a
more detailed description of the LISST-100 and
its operating principle, see Agrawal, 2000. All
data shown for the VABAM is from the 650nm
channel.
- Results
- The VSFs obtained from the LISST more closely
resemble the theoretical results than the VABAM
measurements (Figure 2a,b). - In most cases the VABAM overestimates the
theoretical VSF by up to two orders of magnitude.
- The 5mm bead VSF measured by the LISST captures
the magnitude and shape of the theoretical VSF,
although the strong theoretical resonances are
somewhat damped in the real data by the small
variability in the size of the beads (0.03mm). - The LISST also performed well in capturing the
VSF of the nearly spherical phytoplankton
Dunaliella tertiolecta (Figure 2b). - The VSF (b) can be normalized by the scattering
coefficient b to obtain the phase function. - This normalization yields the phase function
(b), which describes the angular distribution of
the scattering (Mobley, 1994). - We performed a dilution series using 3mm
spheres, and normalized the VSFs to the
attenuation coefficient for each sample
concentration (we assume no absorption by the
beads, so bc) (Figure 3a,b). - The phase functions all fell closely together
for both instruments, except at low
concentrations where the VABAM did not perform
reliably.
Discussion The LISST showed the least
variability at angles greater than 1 degree,
whereas the VABAM showed the opposite trend
(Figure 4a,b). The increased error at small
angles can be attributed to the variability of
the presence of large particles (e.g. aggregated
beads), which disproportionately affect the
signal at the smaller rings. The variability in
the VABAM measurement may be the result of
inconsistent aperture alignment between different
scans. The magnitudes of the VSFs measured by
the VABAM are over an order of magnitude greater
than the theoretical results in most cases
(Figure 2a,b). Though it does have higher angular
resolution than the LISST between some angles
(0.2 3.16), the VABAMs narrow angular range
limits its functionality in inversion models for
estimating a particle size distribution. The
VABAM appears to have the advantage of being a
spectral instrument, but we were never able to
reliably acquire meaningful data with wavelengths
other than 650nm. The 532nm channel and
especially the 455nm channel often produced
negative values for the VSF. All data shown are
from the 650nm output.
Beads
VABAM
b
Figure 4a,b. Variability in VSF measurements from
the LISST bottom curve, N100 and the VABAM
top curve, N72 (a). The coefficient of
variation (CV) for LISST and VABAM measurements
of the VSF for a 5mm bead (b).
Dunaliella
LISST
Conclusion We evaluated the performance of two
instruments that measure forward scattering at
small angles. Various polystyrene spheres and
phytoplankton cultures were prepared in optically
pure water and were sampled simultaneously by the
LISST-100 and the VABAM. The LISST showed closer
agreement than the VABAM with Mie theory for both
the beads and the phytoplankton.
Figure 2a,b. Volume scattering functions from
0.10 20 for 5mm polystyrene beads (a) and for
Dunaliella tertiolecta D5.5mm (b) as measured
by the LISST-100 and the VABAM, and as predicted
by Mie theory.
Figure 3a,b. Phase functions from 0.10 20 for
3mm polystyrene beads as measured by the VABAM
(a) and the LISST-100 (b). The legend shows the
scattering coefficient for each sample
concentration.
References Agrawal, Y.C. and H.C. Pottsmith,
2000. Instruments for particle size and settling
velocity observations in sediment transport. Mar.
Geol. 168, 89-114. Bohren, C.F., and D.R.
Huffman, 1983. Absorption and Scattering of Light
by Small Particles, J. Wiley and Sons, New York,
530 pp. MacCallum, Iain, 2000. Measurement and
Modeling of Phytoplankton Light Scattering, Ph.D.
Thesis, University of Strathclyde, Glasgow, 228
pp. Mobley, Curtis D., 1994. Light and Water
Radiative Transfer in Natural Waters, Academic
Press, Inc., San Diego, 592 pp.
Acknowledgements This work was supported by the
ONR Environmental Optics Program (W.S. Pegau),
and the NSF Biological Oceanography Program (T.J.
Cowles). I would like to thank Jessie Sebbo
(Rutgers) for growing and providing the
phytoplankton, and Emmanuel Boss for supplying
the Mie code.
Recommended
CrystalGraphics Presentations


