
Share of Foodservice Market - PowerPoint PPT Presentation
Title:
Share of Foodservice Market
Description:
Institutions operating own food service: 8.2% Managed services: 6.6 ... Coco's. Transparency 3-6 2006 National Restaurant Association Educational Foundation. ... – PowerPoint PPT presentation
Number of Views:79
Avg rating:3.0/5.0
Title: Share of Foodservice Market
1
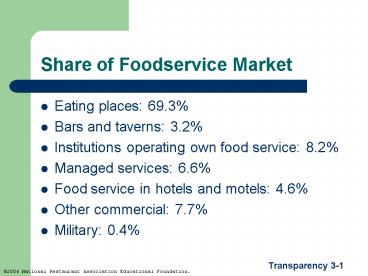
Share of Foodservice Market
- Eating places 69.3
- Bars and taverns 3.2
- Institutions operating own food service 8.2
- Managed services 6.6
- Food service in hotels and motels 4.6
- Other commercial 7.7
- Military 0.4
Transparency 3-1
2
Two Restaurant Markets
- Dining marketServes social needs
- Eating marketServes biological needs
Transparency 3-2
3
Off-premise Dining
- Take-out
- Drive-through
- Delivery
Transparency 3-3
4
Characteristics of Quick-Service Restaurants
- Many locations
- Limited menus
- High and variable sales
- Fast service with much self-service
- Many part-time employees with varied schedules
- Unskilled labor
- Skilled management
- Unit managers in key roles
- Highly competitive prices
- Chains dominate field
- Simple units
- Complex systems
Transparency 3-4
5
Midscale Restaurants
- Family restaurants
- Commercial cafeterias and buffets
- Home meal replacement (HMR)
- Pizza restaurants
Transparency 3-5
6
Ten Largest Family Restaurant Chains
- Dennys
- International House of Pancakes (IHOP)
- Cracker Barrel
- Perkins Family Restaurant
- Bob Evans Farms
- Waffle House
- Boston Market
- Friendlys Restaurants
- Big Boy
- Cocos
Transparency 3-6
7
Casual Restaurants
- Specialty establishments
- Ethnic restaurants
- Eatertainment
Transparency 3-7