
Communicating with Graphs - PowerPoint PPT Presentation
1 / 11
Title:
Communicating with Graphs
Description:
A. Show how a relationship between variables changes over time ... Cherries. 25. Dates. 10. Grapes. 20. Bananas. 7. Other. 3. Communicating with Graphs ... – PowerPoint PPT presentation
Number of Views:87
Avg rating:3.0/5.0
Title: Communicating with Graphs
1
Communicating with Graphs
2
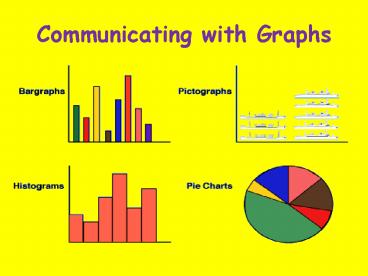
Communicating with Graphs
- Graph A visual display of information or data
- A. Line Graph
- B. Bar Graph
- C. Circle Graph
3
Communicating with Graphs
- 2. Line Graph
- A. Show how a relationship between variables
changes over time - B. Independent Variable is on the X-Axis
(Horizontal Axis) - C. Dependent Variable is on the Y-Axis (Vertical
Axis)
4
Communicating with Graphs
- Graph This
- Average Daily Temperature for
- January 1-7 in Degrees Fahrenheit
5
Communicating with Graphs
Average Daily Temperatures for Jan. 1-7
TEMP.
DATE
6
Communicating with Graphs
- 3. Bar Graph
- A. Compares information collected by counting
- B. Each bar represents a quantity counted at a
particular time - C. Independent Variable is on the X-Axis
(Horizontal Axis) - D. Dependent Variable is on the Y-Axis (Vertical
Axis)
7
Communicating with Graphs
- Graph This
- Money Saved Per Month
8
Communicating with Graphs
Money saved per month
9
Communicating with Graphs
- 4. Circle Graph
- A. Used to show how some fixed quantity is
broken down into parts - B. The pie represents the total the slices
represent the parts - C. The slices are usually represented as
percentages
10
Communicating with Graphs
- Graph this
- Favorite Fruits (100 people)
11
Communicating with Graphs