
Prof' Edward Arens, Architecture - PowerPoint PPT Presentation
1 / 1
Title: Prof' Edward Arens, Architecture
1
Prof. Edward Arens, Architecture Charlie
Huizenga, Research Specialist, CBE Graduate
Students Anna LaRue, Therese Peffer, Xue Chen,
and Jaehwi Jang
Demand Response Enabled Thermostat
Control Strategies and Simulations
Simulation Engine
External Controller
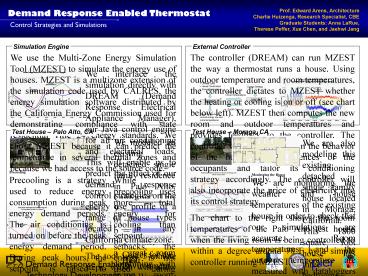
The controller (DREAM) can run MZEST the way a
thermostat runs a house. Using outdoor
temperature and room temperatures, the controller
dictates to MZEST whether the heating or cooling
is on or off (see chart below left). MZEST then
computes the new room and outdoor temperatures
and provides feedback to the controller. The
controller will be able to learn the behavior of
the house and preferences of the occupants and
tailor its conditioning strategy accordingly. The
controller will also incorporate the price of
electricity into its control strategy. The chart
to the right shows the room temperatures of the
Palo Alto test house when the living room is
being controlled to within a degree around 70F
by a simple controller running MZEST.
We use the Multi-Zone Energy Simulation Tool
(MZEST) to simulate the energy use of houses.
MZEST is a multizone extension of the simulation
code used by CALRES, the energy simulation
software distributed by the California Energy
Commission used for demonstrating compliance with
state residential Title 24 energy standards. We
chose MZEST because it can predict the
temperature in several thermal zones and because
we had access to the source code.
We interface the simulation directly with DREAM
(Demand Response Electrical Appliance Manager),
our Java control engine for all air conditioning
and electrical loads. This will enable us to
predict the effect of our demand response control
strategies on the energy use profile of a range
of house types located in any California climate
zone. The tool uses 5-minute steps, which will
allow us to use an external controller to control
MZEST in the same way that the controller would
control a real house. Currently, MZEST heats or
cools the modeled house to meet the needs of only
one zone (the control zone). The other zones are
conditioned, but will generally not exactly meet
the setpoint, especially if there are large
internal gains (see chart to the left) or some
other influence on the temperature of the zones.
Test House Palo Alto, CA
Test House Moraga, CA
We modeled an existing detached single family
residence in Palo Alto, California. This 985
square foot house has two bedrooms, two
bathrooms, and a great room combining with living
room, dining room and kitchen. We tested various
cooling control strategies using this model.
Control strategies include no setback, setback,
demand response setback, and demand response
setback with precooling.
We are also modeling this existing detached
single family house located in Moraga,
California. This 1800 square foot house has three
bedrooms, two bathrooms, bar, living, dining,
kitchen and den. We have modeled the house in
MZEST and will be using DREAM to control both the
simulation and the actual house.
Precooling Precooling is a strategy used to
reduce energy consumption during peak energy
demand periods. The air conditioning is turned on
before the peak energy demand period. During peak
hours, the setpoint is raised to reduce air
conditioning use and the temperature slowly rises
in the house. The graphs below show the
temperature of the test house living room when
controlled to a single cooling setpoint during
the day (left) and when precooling is implemented
between 11 am and 2 pm (right). The graphs also
show hourly cooling energy use.
Monitoring the House We are monitoring the
weather and house temperatures of the existing
house in order to check that our simulations are
accurate. Room temperatures and the outdoor
temperature are measured with dataloggers and
will be measured with Telos radio motes at
1-minute intervals for the DREAM controller. The
recorded weather data are used to create weather
files for the simulation so that behaviors of the
house and the simulation can be compared under
the same weather conditions. The use of the
airhandler for both heating and cooling is also
recorded, so that conditioning behavior can be
scheduled into the simulation to ensure that the
house room and surface temperatures are accurate.
Recent measured weather data, room temperatures,
and conditioning activity are shown in the chart
to the upper left. Simulating the House The
preliminary simulation results of room
temperatures are shown in the lower left chart,
with the house in float mode. This simulation
uses a weather file created with temperature data
recorded by the dataloggers. The living room has
been designated the control zone.
While precooling uses more total energy for
cooling than setpoint setbacks, the energy is not
used during peak demand period between 2 pm and
530 pm (see below). Certain precooling
strategies use less energy for cooling annually
than not using any setbacks.
Center for the Built Environment 390 Wurster
Hall University of California Berkeley, CA
94720-1839
Recommended
CrystalGraphics Presentations


