
Procrustes PCA - PowerPoint PPT Presentation
1 / 44
Title:
Procrustes PCA
Description:
PCA takes your variables (X1, X2, ..., Xp) and returns a new set of variables ... X4: = eye diam. X5: = ... How does PC2 relate to the original variables? ... – PowerPoint PPT presentation
Number of Views:100
Avg rating:3.0/5.0
Title: Procrustes PCA
1
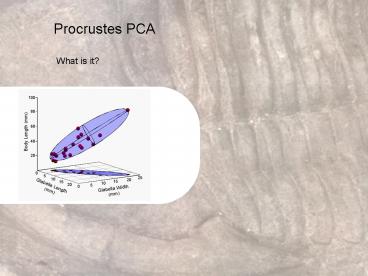
Procrustes PCA
What is it?
2
PCA takes your variables (X1, X2, , Xp) and
returns a new set of variables (Z1, Z2, , Zp),
such that 1. 2. 3. 4.
Length 2
PC2
Length 1
PC1
3
PCA takes your variables (X1, X2, , Xp) and
returns a new set of variables (Z1, Z2, , Zp),
such that 1. the new variables are independent
of one another, 2. the variables are sorted such
that Var(Z1) Var(Z2) Var (Zp) 3. The
relationships among specimens (distances,
relative positions) are preserved, and 4. the
geometric relationships between old (measured)
and new variables are both constant and easy to
interpret in a meaningful, qualitative manner
Length 2
PC2
Length 1
PC1
4
Your new variables are all functions of the old
ones Z11 a11X1 a12X2 a1pXp Z12
a21X1 a22X2 a2pXp Z13 a31X1 a32X2
a3pXp Z1n ap1X1 ap2X2 appXp
The PCA gives you three outputs Scores
locations of specimens along the
PCs Eigenvectors relationships between old and
new measurements Eigenvalues variance explained
by the new measurements
Z11 is the score of specimen 1 along PC1
5
Scores...
Panterinae
PC2
Machairodontinae
Felinae
PC1
What use are the scores?
6
Eigenvectors scores eigenvectors loadings on
original variables -can be used to compute
scores S X.U S scores X original
measurements U eigenvectors
7
Eigenvectors eigenvectors loadings on original
variables
eigenvectors
8
X1 canine L X2 braincase W X3 X4
X5
eigenvectors (loadings)
original data
Z11 (.184)X1 (.166)X2 (.185)X3 (.180)X4
(.162)X46 31.057 Z212 (-.327)X1
(.025)X2 (-.332)X3 (-.352)X4 (.105)X46
4.088
scores
9
Can convert original measurements into PC scores
S X.U
X2
PC2
X1
PC1
S X.U S scores X original measurements U
eigenvectors
When might you project in new specimens?
10
Eigenvectors eigenvectors loadings on
original variables S X.U S scores X
original measurements U eigenvectors And we
can work our way backwards... X S.U-1 U-1
inverse of eigenvectors
11
Now we can go both left to right and right to left
S X.U
Length 2
PC2
X S.U-1
Length 1
PC1
What good is going right to left?
S X.U S scores X original measurements U
eigenvectors
12
Felids PCA
PC-1 loadings (log-transformed measurements) Green
high positive loadingRed high negative
loadingWhite Intermediate
13
(No Transcript)
14
expansion of the central skull, particularly
the zygomatic arch, some elongation of the
eyeclosing of the gap at the rear of the
eye socket ventral, posterior surface of the he
skull shows a size decrease.
cheetah
Pantherinae
Machairodontinae
Felinae
elongation of the facecompression of the
eyeelongation of the glenoid fossaflattening of
rear of skull
PC-1 loadings (log-transformed measurements)
15
X1 canine L X2 braincase W X3 braincase
H X4 eye diam. X5
How does PC2 relate to the original variables?
16
X1 canine L X2 braincase W X3 braincase
H X4 eye diam. X5
How does PC2 relate to the original
variables? PC2 a1X1 - 3.24X2 .456X3
apXp As X3?, PC2? ... As X2?, PC2? Or, as we
move up PC2, X2 should decreaseand X3 should
increase.
17
High PC2
Low PC2
X1 canine L X2 braincase W X3 braincase
H X4 eye diam. X5
How does PC2 relate to the original
variables? PC2 a1X1 - 3.24X2 .456X3
apXp As X3?, PC2? ... As X2?, PC2? Or, as we
move up PC2, X2 should decreaseand X3 should
increase.
18
High PC2
Low PC2
Is there a more rigorous way to do this?
X S.U-1 X orginal measurements S PC
scores U-1 inverse of eigenvectors
19
Analyzing just two measurements braincase H, W.
20
Panterinae
Felinae
Machairodontinae
PCA results PC2, U
21
S X.U
Panterinae
Felinae
shape models
Machairodontinae
X S.U-1
PCA results PC2, U U-1
22
Panterinae
Felinae
Machairodontinae
PCA results PC2 MeanPC1 120.3 model
positions (120.3, -15.5), (120.3, -5.4), (120.3,
4.6), (120.3, 14.78), (120.3, 24.7)
23
measurement values model locations . U-1
.
24
5
Panterinae
4
3
2
Felinae
Machairodontinae
1
5
3
model locations . U-1
1
25
Weve been analyzing a measurement net. Is there
a better set of measurements to record?
26
PCA on the raw coordinates -what are the sources
of variance? -are they all relevant to our
biological question?
27
PCA on the centered coordinates, specimen
centroids at (0,0) -what are the sources of
variance? -are they all relevant to our
biological question?
28
PCA on the Procrustes (GLS) aligned
specimens -what are the sources of variance? -are
they all relevant to our biological question?
29
PCA on the Procrustes (GLS) aligned
specimens -Just the coordinates... why is this
better than the distances?
x2
x1
y2
y1
30
Example What does the average panther look like?
Panterinae
PC2
Machairodontinae
Felinae
PC1
31
What does the average panther look like?-compute
the mean
Panterinae
PC2
Machairodontinae
Felinae
PC1
32
What does the average panther look
like? -Compute mean for all members of
Panterinae -Project that position back into the
original space
X S.U-1 panther mean shape row of mean
scores.U-1 x1, y1, x2, y2, ... 334.3,
64.8, -9.6, ... . U-1
33
What does the average panther look
like? Scatter of panthers (blue) and mean
(red) -actually, the mean of the aligned
coordinates is the same as the backprojection of
the mean of the scores.
34
Shape models
want to visualize along each axis in turn
Panterinae
PC2
Machairodontinae
Felinae
PC1
35
Shape models
How about visualizing distinct steps along the
axes?
Panterinae
PC2
36
Shape models
How about visualizing distinct steps along the
axes?
Panterinae
PC2
37
Shape models
How about visualizing distinct steps along the
axes?
Panterinae
PC2
38
Shape models
Overlay all 5 models instead...
39
Shape models
Another option the thin plate spline This
visualizes the changes as deformations to a grid
on a thin metal plate.
40
Shape models
Another option the thin plate spline This
visualizes the changes as deformations to a grid
on a thin metal plate.
41
Shape models
Another option the thin plate spline Use this to
interpret Procrustes PC-1
42
Shape models
PPC-2
43
Shape models
What distinguishes pantherinae and felinae? (PPC1
- 54 of variance)
Panterinae
PPC2
44
Shape models
How do you look at allometry in this
context? -Norm will talk about this next, and
well see in lab today (basically, regress the x
and y coordinates separately against size)
Recommended
CrystalGraphics Presentations


