
10 TerraMODIS Images for Aug. 14, 2005 - PowerPoint PPT Presentation
1 / 47
Title: 10 TerraMODIS Images for Aug. 14, 2005
1
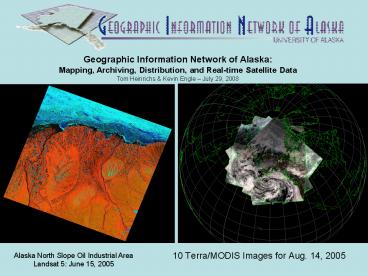
Geographic Information Network of Alaska
Mapping, Archiving, Distribution, and Real-time
Satellite Data Tom Heinrichs Kevin Engle July
29, 2008
- 10 Terra/MODIS Images for Aug. 14, 2005
Alaska North Slope Oil Industrial Area Landsat 5
June 15, 2005
2
- GINA is
- Real-time Satellite Imagery and Data
- Received by GINA
- Received in partnership with others (NOAA/NESDIS
Fairbanks ground station) - Geospatial Data
- State clearinghouse for imagery and elevation
data - Statewide Digital Mapping Initiative (SDMI)
- North Slope Science Initiative data management
(catalog.northslope.org) - Raster (images, grids)
- Vector (point, line, polygon)
- Metadata
- Software
- SwathViewer (sv.gina.alaska.edu)
- Statewide Mapping (www.alaskamapped.org)
www.gina.alaska.edu
3
(No Transcript)
4
3.6-meter Antenna SeaSpace X-band Ground
Station MODIS on NASA Terra and Aqua
1.2-meter Antenna SeaSpace L-band Ground
Station AVHRR on NOAA polar orbiters SeaWiFS
5
NOAA / NESDIS Fairbanks
6
NOAA / NESDIS Barrow
7
- FCDAS Barrow station increases AVHRR mask over
critical areas - FCDAS Fairbanks antennas provide critical backup
to GINA reception - Users include
- National Weather Service
- Alaska Volcano Observatory
- CANATEC Ice Consulting
- Alaska Fire Service
8
MODIS250-meterImageryJune 29, 2004
When all our resources are either grounded or
used up, MODIS is there providing us data several
times a day, statewide. --Corey Doolin, Zone
Coordinator Upper Yukon Zone BLM
9
(No Transcript)
10
(No Transcript)
11
MODIS was great in detecting fires in remote
locations. Almost this entire summer we were out
of resources used for detection flights,
MODIS filled the gap for us. --Corey Doolin,
Zone Coordinator Upper Yukon Zone BLM
12
NOAA-18 Polar Winds
Jeff Key - Univ of Wisconsin
13
All Sensors - Polar Winds
14
(No Transcript)
15
DMSP NWS, Air Force, FCDAS, GINA
- From Air Force Out Brief
- The Elmendorf AFB Mark IVB will be removed
- This site is used by the 11th OWS, subordinate AF
units, the NWS Alaska Region Headquarters (ARH),
and subordinate NWS ARH WFO. - The 11th 17th OWS and NWS ARH require the DMSP
RTD capability provided by the Mark IVB to
persist current operations - Multi-agency collaboration needed to achieve
this solution
16
GINA Imagery for the Alaska Volcano
ObservatoryAugustine Volcano December 12, 2005
17
Caribou Hills Fire, June 2007, Kenai Peninsula,
Alaska
18
MODIS - Okmok Volcano - July 13, 2008
19
Real-time Satellite Data Users
- National Weather Service
- Air Force Weather Service
- Alaska Fire Service
- Alaska Volcano Observatory
- Fairweather, Inc.
- Alaska Ocean Observing System
- Hokkaido University and JAXA scientists
- USFS Remote Sensing Application Center (Wildfire)
- And more
20
North Slope Science Initiative
21
North Slope Science Initiative
22
North Slope Science Initiative Data System
catalog.northslope.org
23
North Slope Science Initiative Catalog
24
Alaska Statewide Digital Mapping Initiative
- www.alaskamapped.org
25
The Problems with Current Maps
- Imagery out of date
- Alaska last photographed in entirety in 1978-1986
- Film imagery (some has been scanned)
- About 30 of the state has high-resolution
imagery less than 5 years old - Digital Elevation Models (DEM)
- Coarse 30 meter spacing
- Inaccurate created by digitizing USGS
topographic maps made in the 1950s using poorly
controlled air photography
26
Alaska High-Altitude Photography Program
- Alaska was photographed from high-altitude U-2
and ER-2 aircraft between 1978 and 1986 under a
multi-agency, State and Federal partnership led
by the USGS.
27
Digital Elevation Models
- Critical uses
- Engineering and permitting transportation,
energy, environmental, hydrology - Aviation civilian and military
- Mapping the foundation of accurate maps and
orthoimages
28
Color swaths indicate the number of times the
area was imaged by SRTM
1
2
3
4
?
0
29
SDMI Program Goals
- Better map information ? leading to
- Better decision making
- Well-informed resource management
- Cost savings
- Improved planning and regulatory certainty (risk
reduction) - More efficient fieldwork
- Imagery and DEM dollars well-spent
30
Web Mapping Service Engine Provides Best
Available Imagery For Region In Clients View
Google Maps Interface Data Downloaded
Capability KML
AlaskaMapped.Org
31
(No Transcript)
32
Integration into State Enterprise Applications -
DNR/LRIS SDMI WMS Feed of Landsat with State
Mining Claims -Synergistic and Enhanced Contact
with State Customers
33
A Few Additional SDMI Web Services ExamplesSDMI
WMS Feed of National Elevation Data Model
Hillshade
34
SDMI WMS Feed of Statewide USGS Topographic Maps
35
SDMI NOAA Charts Via WMS
36
SDMI WMS Feed of Statewide Nautical Charts - NOAA
37
NOAA / NESDIS Fairbanks
Statewide Digital Mapping Initiative SPOT
satellite ground receiving station
38
JW Dalton Well -- National Petroleum Reserve
AlaskaMotivations for Good Mapping Coastal
Erosion and Energy Development
http//www.doi.gov/greening/awards/2006_Dalton.htm
l
39
JW Dalton Well -- National Petroleum Reserve
Alaska1955 1979 2002
450 meters
40
(No Transcript)
41
(No Transcript)
42
SPOT ground station
43
We will use SPOT imagery to help our work to
understand coastal dynamics in Alaska. Having
immediate pre- and post-storm assessments of
coastline position will greatly aid our capacity
to link storm and ocean wave energetics to
resultant erosion. Use of the imagery for sea ice
and offshore ocean wave monitoring will also
assist our coastal zone efforts. David E
Atkinson IARC/UAF Professor
Erosion Damage at Shishmaref, Alaska
44
The NOAA National Weather Service, Alaska Region,
is very interested in acquiring SPOT data. It
will be particularly helpful for sea ice, river
breakup, wildfires, coastal erosion and
inundation. We have an excellent working
relationship with both the FCDAS and UAF in
sharing satellite data. Laura Furgione NOAA
National Weather Service Regional Director
Bering Sea, Alaska
45
Coastal sea ice, tundra lake and lagoon near
Barrow, Alaska
The high spectral and spatial resolution of SPOT
data will be of great value in our studies of
sea-ice surface melt and the impact of meltwater
hydrology on ice albedo. SPOT imagery will also
help us quantify sediment transport by sea ice in
coastal and offshore environments. Hajo
Eicken UAF Professor
46
We will use SPOT imagery to help our program of
monitoring Alaskan glaciers and climate. It will
be a valuable supplement to our site observations
at a limited number of glaciers and allow us to
draw broader scale conclusions. We anticipate
mass balance, ice dynamics, surge observations,
and climate change applications to benefit. Rod S
March USGS Glaciologist
Gulkana Glacier, Alaska
47
Geographic Information Network of Alaska
Mapping, Archiving, Distribution, and Real-time
Satellite Data
- 10 Terra/MODIS Images for Aug. 14, 2005
Alaska North Slope Oil Industrial Area Landsat 5
June 15, 2005
Recommended
CrystalGraphics Presentations


