
Introduction to Satellite Remote Sensing PowerPoint PPT Presentation
1 / 90
Title: Introduction to Satellite Remote Sensing
1
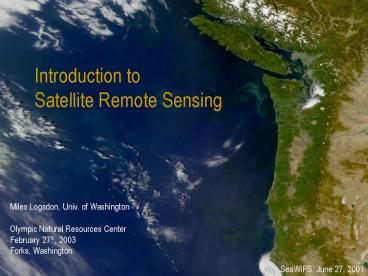
Introduction to Satellite Remote Sensing
Miles Logsdon, Univ. of Washington Olympic
Natural Resources Center February 27th,
2003 Forks, Washington
SeaWiFS, June 27, 2001
2
My agenda
- Show you pretty pictures
- Introduce Remote Sensing terms and concepts
- Get the language down
- Think about the future
3
What is Remote Sensing and Image Classification?
- Remote Sensing is a technology for sampling
radiation and force fields to acquire and
interpret geospatial data to develop information
about features, objects, and classes on Earth's
land surface, oceans, and atmosphere (and, where
applicable, on the exterior's of other bodies in
the solar system). - Remote Sensing is detecting and measuring of
electromagnetic energy (usually photons)
emanating from distant objects made of various
materials, so that we can identify and categorize
these object by class or type, substance, and
spatial distribution - Image Classification has the overall objective to
automatically categorize all pixels in an image
into classes or themes. The Spectral pattern, or
signature of surface materials belonging to a
class or theme determines an assignment to a
class.
4
Specifically, we measure radiation produced in
three ways1. Emitted from the surface (thermal
IR)2. Reflected from the surface (solar)3.
Reflected from energy pulses directed at the
surface (RADAR)
5
Path 47 Row 26 27 8/2/98
Path 46 Row 26 27 8/27/98
6
Classified Product
7
MOD11 Daytime (8-day averaged) Land Surface
Temperature June 2002
3o C
50o C
Temperature (oC)
8
MOD13 NDVI (16-day) 500m resolution June 2002
Low
High
(bright photosynthesizing vegetation)
9
Our collection Pacific Northeast, Apr Sep,
1999 - 2001
Ocean Remote Sensing
SeaWifs, 1999, 1km monthly mean chlorophyll-a
estimates
Apr
May
Jun
Jul
Aug
Sep
10
Classified land surface response
June, 1981
Dec. 1998
11
Image Classification
12
(No Transcript)
13
First A few Simple Reminders about Spectral
Signatures
Thanks to Robin Weeks
14
Coordinate system used with satellite sensors
qZ Zenith angle q Look or incidence angle
qS Solar zenith angle
15
(No Transcript)
16
(No Transcript)
17
(No Transcript)
18
(No Transcript)
19
Three kinds of scanners
- Whisk-broom (cross-track)
- Push-broom (along-track)
- Hybrid cross-track
20
Whisk-broom or cross-track scanner Examples
AVHRR, SeaWiFS. Notice how field-of-view (FOV)
changes with look angle.
Advantages single detector scans across the
entire path, can be calibrated on each rotation.
21
Because of off-nadir look angle and Earths
curvature, field-of-view increases with zenith
angle.
22
Push-broom or along-track scanner examples
include Landsat-7, MERIS
Advantages longer dwell time, better
resolution Disadvantages unwieldy number of
sensors for wide swaths
23
Hybrid cross-track MODIS, VIIRS
Advantages multiple sensors in along-track
direction increase dwell time by allowing for a
slower rotation rate. MODIS has 10 such sensors
per channel. But wide swath width leads to a
phenomena called the bowtie effect.
24
Two kinds of solar reflection in the visible
Direct surface reflection, diffuse sub-surface
backscatter
25
Vertical structure of the Atmosphere
26
When radiation interacts with the atmosphere,
then depending on the wavelength, the three
things that happen are Absorption,
Scattering, Emission.
27
The Effect of the Atmosphere on Spectral Data
Path Radiance (Lp)
Atmospheric Transmissivity (T)
Thanks to Robin Weeks
28
Absorption and EmissionMolecules absorb
and emit by changing their quantum state. This
phenomena is a function of frequency. Because the
atmospheric temperature is about 300K, absorption
only matters in the infrared and microwave.
29
ScatteringThere are two kinds
of scattering,Rayleigh or molecular scatter,
which only matters in the visible
andMei or aerosol scatter
(scatter from raindrops, sulfuric acid droplets,
salt particles) which matter at much longer
wavelengths.
30
Rayleigh Scatter
31
Relative importance of attenuation, emission and
scattering
VIS IR-clear
sky Microwave (no rain) Attenuation
maybe Y
Y Emission N
Y Y Scattering
Y N
N
32
(No Transcript)
33
Solar scattering generates a Rayleigh path
radiance
34
Kinds of reflection
35
Effect of Topography on Scatterplots
Grassy fields
Flat terrain
Terrain without topography
Water/ shade
Bare ground
Terrain with topography
Thanks to Robin Weeks
36
The PIXEL
37
Wavelength (Bands)
38
Band Combinations
R,G,B
3,2,1
R,G,B
4,3,2
R,G,B
5,4,3
39
We approach RS in two ways
- To classify or group thematic land surface
materials - To detect a biophysical process
40
Cluster and Classify
41
Spectral Profile
42
Spatial Profile
43
Spectral Signatures
44
1d classifier
45
Spectral Dimensions
46
3 band space
47
Clusters
48
Dimensionality
N the number of bands dimensions . an (n)
dimensional data (feature) space
Measurement Vector
Mean Vector
Feature Space - 2dimensions
190 85
Band B
Band A
49
Spectral Distance
a number that allows two measurement vectors to
be compared
50
Classification Approaches
- Unsupervised self organizing
- Supervised training
- Hybrid self organization by categories
- Spectral Mixture Analysis sub-pixel variations.
51
Clustering / Classification
- Clustering or Training Stage
- Through actions of either the analysts
supervision or an unsupervised algorithm, a
numeric description of the spectral attribute of
each class is determined (a multi-spectral
cluster mean signature). - Classification Stage
- By comparing the spectral signature to of a pixel
(the measure signature) to the each cluster
signature a pixel is assigned to a category or
class.
52
terms
- Parametric based upon statistical parameters
(mean standard deviation) - Non-Parametric based upon objects (polygons) in
feature space - Decision Rules rules for sorting pixels into
classes
53
Resolution and Spectral Mixing
54
(No Transcript)
55
ClusteringMinimum Spectral Distance -
unsupervised
Band B
Band A
Band B
Band A
1st iteration cluster mean
2nd iteration cluster mean
56
ISODATA clusters
57
Unsupervised ClassificationISODATA - Iterative
Self-Organizing Data Analysis Technique
58
Supervised Classification
59
Classification Decision Rules
- Non-Parametric
- parallelepiped
- feature space
- Unclassified Options
- parametric rule
- unclassified
- Overlap Options
- parametric rule
- by order
- unclassified
- Parametric
- minimum distance
- Mahalanobis distance
- maximum likelihood
- If the non-parametric test results in one unique
class, the pixel will be assigned to that class. - if the non-parametric test results in zero
classes (outside the decision boundaries) the the
unclassified rule applies either left
unclassified or classified by the parametric rule - if the pixel falls into more than one class the
overlap rule applies left unclassified, use the
parametric rule, or processing order
60
Parallelepiped
- Maximum likelihood
- (bayesian)
- probability
- Bayesian, a prior (weights)
Band B
Band A
Minimum Distance
Band B
Band A
61
Parametric classifiers
62
Classification Systems
USGS - U.S. Geological Survey Land Cover
Classification Scheme for Remote Sensor Data
USFW - U.S. Fish Wildlife Wetland
Classification System NOAA CCAP - C-CAP
Landcover Classification System, and Definitions
NOAA CCAP - C-CAP Wetland Classification Scheme
Definitions PRISM - PRISM General Landcover
King Co. - King County General Landcover
(specific use, by Chris Pyle)
- Level
- 1 Urban or Built-Up Land
- 11 Residential
- 12 Commercial and Services
- 13 Industrial
- 14 Transportation, Communications and Utilities
- 15 Industrial and Commercial Complexes
- 16 Mixed Urban or Built-Up
- 17 Other Urban or Built-up Land
- 2 Agricultural Land
- 21 Cropland and Pasture
- 22 Orchards, Groves, Vineyards, Nurseries and
Ornamental Horticultural Areas - 23 Confined Feeding Operations
- 24 Other Agricultural Land
63
A quick run through Of image classification
64
Landsat TM Image August 27, 1998 7 Bands 4,3,2
Displayed
65
- Geo-registration and
- Atmospheric correction
66
(No Transcript)
67
Band 4 (NiR)
Band 3 (Red)
68
Spectral Signatures of Vegetation
69
Feature Space
70
Clusters
71
Ground Truth
72
(No Transcript)
73
A Typical Aggregation (L1) and Color Set
74
Using Different Aggregation of Level 3
75
Detecting a Process Two examples Using band
math
76
Laboratory Spectral Signatures IICommon Urban
Materials
Healthy grass
Concrete
Astroturf
wavelength
Thanks to Robin Weeks
77
VegetationPigment in Plant Leaves
(Chlorophyll) strongly absorbs visible light (0.4
to 0.7 µm)Cell Structure however strongly
reflects Near-IR (0.7 1.1 µm)
Thanks to Robin Weeks
78
NDVI
When using LANDSAT
Simple Ratio
Band 3 Band 4
NDVI
Band 4 - Band 3 Band 4 Band 3
(courtesy http//earthobservatory.nasa.gov)
79
Ocean Color
- Lets begin with phytoplankton
- Phyton plant planktos wandering.
- These reproduce asexually, are globally
distributed, consist of 10s of thousands of
species and make up about 25 of the total
planetary veg. - These are the grass that the zooplankton graze
upon. - And, they fix carbon as well.
80
Chloroplasts contain pigments
Chaetoceros species of diatoms cells are 20-25
mm in diameter.
81
(No Transcript)
82
Colored Dissolved Organic Material (CDOM)
- Organic Sources
- Terrestrial CDOM
- decay vegetation from river and nearshore
- Ocean CDOM
- detritus - cell fragments, zooplankton fecal
- Inorganic Sources
- Sand Dust gt Errosion
- rivers, wind, wave or current suspension
83
R(l)
Florescence
Independent of Chl-a
Chl-a increasing
84
SeaWiFS empirical OC4 algorithm for Chl-a Called
a maximum-band ratio alg.
85
(No Transcript)
86
SeaWifs, April 24, 1999
Thanks to Seelye Martion
87
http//learn.arc.nasa.gov/ http//www.earth.na
sa.gov/
88
Flying
89
Produce monthly land indices related to natural
hazards Integrate products with existing static
data Provide basic assessments for specific
risks based upon changing trends
90
Distributed Data and Information Systems -
Metadata tags using XML (content descriptions in
a shared language) - Data source and sink
services (actions on data preformed at the source
or at the end user) - Flow of data and metadata
continuously (push content to data sinks
mediated by data relay nodes)
Sink
Source
Metadata in XML
Data Flow
Recommended
