
Unemployment
1 / 22
Title:
Unemployment
Description:
Civilian Labor Force Participation, Employment, and Unemployment Rates in the ... evidence on the impact of unemployment benefits, Ehrenberg and Oaxaca, AER, 1976 ... – PowerPoint PPT presentation
Number of Views:2245
Avg rating:3.0/5.0
Title: Unemployment
1
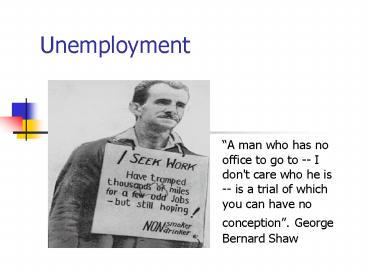
Unemployment
- A man who has no office to go to -- I don't care
who he is -- is a trial of which you can have no
conception. George Bernard Shaw
2
Civilian Labor Force Participation, Employment,
and Unemployment Rates in the United States (in
percentages)
3
FIGURE 15.1 Labor Market Stocks and Flows May
1993
4
Sources of Unemployment, United States, Various
Years
5
Steady-state level of unemployment (Martson
(1976), Employment Instability and High
Unemployment Rates, Brookings Papers on Economic
Activity, 169-203)
6
Unemployed Persons by Duration of Unemployment,
1948-2002
Uaverage incidence rateaverage duration rate
7
Unemployment Rates by Education Attainment,
1970-2005
8
Frictional Unemployment and the Job Search model
The wage offer distribution gives the frequency
distribution of potential job offers. A given
worker can get a job paying anywhere from 5 to
25 per hour.
9
The Determination of the Asking Wage
The marginal revenue curve gives the gain from an
additional search. It is downward sloping because
the better the offer at hand, the less there is
to gain from an additional search. The marginal
cost curve gives the cost of an additional
search. It is upward sloping because the better
the job offer at hand, the greater the
opportunity cost of an additional search. The
asking wage equates the marginal revenue and the
marginal cost of search.
10
Discount Rates, Unemployment Insurance, and the
Asking Wage
11
The Relationship Between the Probability of
Finding a New Job and UI Benefits
12
Funding the UI System Imperfect Experience Rating
If the firm has very few layoffs (below threshold
l0), the firm is assessed a very low tax rate to
fund the UI system. If the firm has had many
layoffs in the past (above some threshold l1),
the firm is assessed a tax rate, but this tax
rate is capped at tMAX.
13
Some evidence on the impact of unemployment
benefits, Ehrenberg and Oaxaca, AER, 1976
14
Other conceptual frameworks for explaining the
existence of unemployment
- The intertemporal substitution hypothesis (Lucas
and Rapping, 1969) - The aggregate demand versus sectoral shifts
hypothesis (e.g. Abraham and Katz, 1986) - The efficiency wage hypothesis (Shapiro and
Shtiglitz, 1984) wage curve (Card, 1995) - The implicit contract hypothesis (Aziaridis,
1975 Rosen, 1985 Beaudry and DiNardo, 1991) - Below well outline the theoretical framework of
the efficiency wage model and well discuss some
empirical evidence on each in class
15
The Efficiency Wage Model
If shirking is not a problem, the market clears
at wage w (where supply S equals demand D). If
monitoring is expensive, the threat of
unemployment can keep workers in line. If
unemployment is high (point F), firms can attract
workers who will not shirk at a very low wage. If
unemployment is low (point G), firms must pay a
very high wage to ensure that workers do not
shirk. The efficiency wage wNS is given by the
intersection of the no-shirking supply curve (NS)
and the demand curve.
16
The Impact of an Economic Contraction on the
Efficiency Wage
S
A fall in output demand shifts the labor demand
curve from D0 to D1. The competitive wage falls
from to . If firms pay an efficiency wage, the
contraction in demand also reduces the efficiency
wage but by a smaller amount.
17
The Wage Curve The Relation Between Wage Levels
and Unemployment Across Regions
Geographic regions (such as B) that offer higher
wage rates also tend to have lower unemployment
rates.
Check Card- the wage curve-JLE
18
The Phillips Curve
- A downward-sloping Phillips curve can only exist
in the short run. - In the long run, there is no trade-off between
inflation and unemployment.
19
The Phillips Curve
The Phillips curve describes the negative
correlation between the inflation rate and the
unemployment rate. The curve implies that an
economy faces a trade-off between inflation and
unemployment.
20
Inflation and Unemployment in the United States,
1961-2005
21
The Short-Run and Long-Run Phillips Curves
22
North American-European unemployment compared
- Nickell (1997), Unemployment and Labor Market
Rigidities Europe versus North America, Journal
of Economic Perspectives, 11 (3), 55-74 is a
great reference. Well go through some of the
tables and discussions in class.
Recommended
CrystalGraphics Presentations


