
Local Analysis and Prediction System - PowerPoint PPT Presentation
1 / 29
Title:
Local Analysis and Prediction System
Description:
All within the local weather office. Basic data sources. Radar. Satellite. Surface Obs ... Diagnose local weather features to enhance conceptual models ... – PowerPoint PPT presentation
Number of Views:147
Avg rating:3.0/5.0
Title: Local Analysis and Prediction System
1
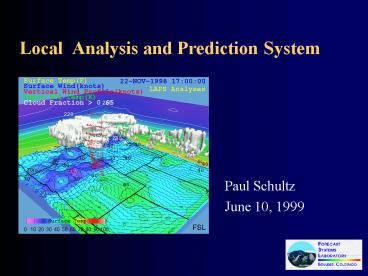
Local Analysis and Prediction System
- Paul Schultz
- June 10, 1999
2
LAPS
- A system designed to
- Exploit all available data sources
- Create analyzed and forecast grids
- Build products for specific forecast applications
- Use advanced display technology
- All within the local weather office
3
Basic data sources
- Radar
- Satellite
- Surface Obs
- RAOBs
- Profilers
- ACARS
- Larger-scale models (background, LBC)
4
Well emphasize LAPS in NWS AWIPS today...
- but LAPS is being used by Space Flight Centers
(Vandenburg, Kennedy), USAF Global Weather
Center, many others
5
Heres how it looks on AWIPS
6
Relationship between NWS and FSL
7
THE CONCEPT OF THE LOCAL DATA BASE IS CENTRAL TO
FUTURE OPERATIONSTHE MOST COMPLETE DATA SETS
WILL ONLY BE AVAILABLE TO THE LOCAL WFO. THE NEW
OBSERVING SYSTEMS ARE DESIGNED TO PROVIDE DATA TO
BE INTEGRATED INTO 3-DIMENSIONAL DEPICTIONS OF
THE RAPIDLY CHANGING STATE OF THE ENVIRONMENT.
- -- from the strategic plan for the modernization
and associated restructuring of the National
Weather Service
8
A decade of NWS development
- All new satellites, radars, surface observation
equipment - Satellite-based telecommunications to support
field offices - Cool computer workstations (AWIPS)
- New telecommunications front end to support users
(LDAD) - New forecast products and services
9
WSR-88D
cp2
ws1
SBN
cp1
ws2
LDAD
firewall
workstation subnet
ds1
ds2
as1
as2
Basic AWIPS setup
10
LDAD in NWS Forecast Offices
Hydro nets, road sensors, agriculture mesonets
Emergency preparedness
Internal LAN (IP)
LDAD - LAN ( IP)
Dedicated Modem
Observing platforms
Backup Server
Async MUX
AWIPS
Security Firewall
Dial Modem
wkst
VIR Switch
Interactive menu
LDAD Server
Async MUX
DTMF Conv
FAX Modem
Spotters, coop observers
Existing Router
Public schools, police cars
Public
11
(No Transcript)
12
(No Transcript)
13
LAPS on AWIPS
- Analysis only (for now).
- Domain is (for now) at 61x61x21, dxdy10km,
dp50mb. Cycle time is 1 hr. - 3d temperature, wind, humidity, cloud fraction,
mixing ratios of vapor, cloud liquid, cloud ice,
rain, snow, graupel. - Lots of derived fields.
14
Data sources for LAPS in AWIPS
- RUC provides first guess
- Surface metars, buoys, satellite IR for ?T,
local obs via LDAD (v4.2) - Upper winds profiler (not ACARS, WSR88D)
- Clouds WSR88D reflectivity, satellite IRvis,
metars (not pireps, radiometers) - Water vapor cloud fields 11.7? (not ACARS,
radiometers, GPS)
15
Why Run Models in the Weather Office?
- Diagnose local weather features to enhance
conceptual models - sea/mountain breezes
- modulation of synoptic scale features
- Take advantage of high resolution terrain data to
downscale national model forecasts - orography is a data source!
16
Why Run Models in the Weather Office? (cont.)
- Take advantage of unique local data
- radar
- surface mesonets
- Have an NWP tool under local control for
scheduled and special support - Best reason better precip forecasts
17
(No Transcript)
18
(No Transcript)
19
Why not run models in NWS forecast offices?
- NWS hasnt figured out how to support modeling.
- NWS/NCEP/EMC is not convinced it will provide
useful guidance or otherwise lead to better
forecasts. - NWS/NCEP/EMC believes AWIPS telecomms will
eventually catch up. - NWS and PRC havent negotiated the infrastructure
management. - Hardware cost is not an issue.
20
Hardware cost is not an issue!
- The computer required to run a nested grid with
an interior 5-km grid covering WFO area of
responsibility plus plenty more, costs less than
5000 today! (Based on an assumed requirement to
complete a 27-hr forecast in under three hours.)
21
Which model?
- Practically any public-domain nestable
nonhydrostatic model is fine (MM5, COAMPS, ARPS,
SFM). - Eta okay too, but its not nestable, so a larger
fine grid is required offsets efficiency
advantage. - No technical reason not to have them all.
22
WSR
External source
cp2
ws1
SBN
cp1
ws2
LDAD subnet
firewall
workstation subnet
ds1
ds2
as3
as1
as2
any computer
AWIPS local model implementation options
23
Heres how it looks on AWIPS ------ Same grid as
analyses LBC from Eta Runs four times out to 18
hrs per day at WFO/BOU Runs automatically, 95
reliability
24
NWP Explicit Microphysics
Evaporation is not shown
deposition
aggregation
nucleation
melting
freeze/melt
accretion
freeze/melt
coalescence
saturated updraft
precip
precip
precip
precip
25
Plans
- Better integration of surface and 3D fields
- Direct assimilation methods of satellite
radiances, microwave sensors, radar reflectivity - Hot start for model
- Shallow cumulus parameterization
- Graphical user interface for grid configuration,
data quality control, process monitoring,
verification
26
(No Transcript)
27
(No Transcript)
28
LAPS People
- Steve Albers 3d winds, temperature, clouds
- Pete Stamus surface analyzed and derived
products - Dan Birkenheuer 3d humidity
- John Smart data ingest, preprocessing
- Jim Edwards software design
- John McGinley variational methods, QC
- Paul Schultz, John Snook local model
29
- Heres our web site
- http//laps.fsl.noaa.gov
- Email anybody in the group
- lastname_at_fsl.noaa.gov
- John McGinley, LAPS Branch Chief, FSL
- Paul Schultz, AWIPS contact