
Weather Maps - PowerPoint PPT Presentation
1 / 20
Title:
Weather Maps
Description:
The speed is indicated by the barbs or pennants attached to the 'arrow' ... Pennant represents 50 knots. Examples. Calm. 13 - 17 Knots. 58 - 62 Knots. 9 ... – PowerPoint PPT presentation
Number of Views:375
Avg rating:3.0/5.0
Title: Weather Maps
1
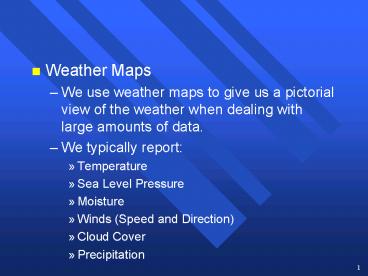
- Weather Maps
- We use weather maps to give us a pictorial view
of the weather when dealing with large amounts of
data. - We typically report
- Temperature
- Sea Level Pressure
- Moisture
- Winds (Speed and Direction)
- Cloud Cover
- Precipitation
2
Surface Station Model
- A station model is a pictorial way of
representing the weather data recorded at a
specific site.
A simplified station model This represents the
typical data reported at a station. Some
stations may report more or less.
3
Surface Station Model
A simplified station model T Temperature
(Fahrenheit) Td Dew Point Temperature Vis.
Visibility (miles) Wx Present Weather Press
Sea Level Pressure Precip. Precipitation
amount (Liquid Equiv. In inches) dd Wind
Direction (degrees) ff Wind Speed (knots)
4
Surface Station Model
A station model EXAMPLE Temperature 90 F Dew
Point 68 F Visibility 10 Miles Present
Weather Rain Shower Press 1001.0
mb Precipitation 0.05 inches Wind Direction
North -- 00 Degrees Wind Speed 24 knots Cloud
cover 9/10 Clouds
5
Surface Closeup
At Oklahoma City (OKC) Temperature 82
F Pressure 1001.0 mb Dew Point 64 F Weather
Partly Cloudy Winds Southeast at 3-7 knots.
6
Surface Station Model
- Comments on reporting pressure
- The pressure is reported in millibars (tens,
units, and tenths -- the leading 9 or 10 is
omitted) reduced to seal level.
Examples
1014.7 mb 986.3 mb
147 863
7
Surface Station Model
- Comments on reporting wind
- The direction is reported, in degrees, from where
the wind comes from.
Examples
Southwest Wind
North Wind
East Wind
8
Surface Station Model
- Comments on reporting wind
- The speed is indicated by the barbs or pennants
attached to the arrow. - Half barb represents 3-7 knots
- Full barb represents 8-12 knots
- Pennant represents 50 knots
Examples
Calm
13 - 17 Knots
58 - 62 Knots
9
Surface Maps -- Pressure Systems
- Low Pressure
- Typical Weather
- Cloudy
- Windy
- Warmer
- Precipitation
- Flow around a low is cyclonic (counterclockwise
in the Northern Hemisphere) - Stronger pressure gradient
- Pressure changes more rapidly over a given
distance.
10
Surface Maps -- Pressure Systems
- High Pressure
- Typical Weather
- Clear
- Light Winds
- Cooler
- Dry
- Flow around a low is anticyclonic (clockwise in
the Northern Hemisphere) - Weaker pressure gradient
- Pressure changes less rapidly over a given
distance.
11
Surface Analysis
Fronts Boundaries between large regions of
air (air masses) with differing temperature,
humidity, or both.
- Warm Front
- Long periods of clouds, winds, and precipitation
- Warm, moist air after frontal passage
- Occasionally produces severe weather
- Denoted by a red line with red half-circles that
point toward cold air.
12
Surface Analysis
Fronts Boundaries between large regions of
air (air masses) with differing temperature,
humidity, or both.
- Cold Front
- Shorter periods of clouds, winds, and
precipitation - Cold, dry air after frontal passage
- Often produces severe weather in spring
- Denoted by a blue line with blue triangles that
point toward warm air.
13
Surface Analysis -- 12 Jan 98
Snow
Cold Front
High Pressure
Warm Front
Low Pressure
Rain
Fog
Isobars Lines of Constant Pressure
14
Surface Analysis -- 20 Aug 98
Cold Front
Low Pressure
High Pressure
Tropical Depression
Isobars Lines of Constant Pressure
Image from The Weather Channel
15
Upper Air Station Model
- A station model is a pictorial way of
representing the weather data recorded at a
specific site.
A simplified station model This represents the
typical data reported at a station. Some
stations may report more or less.
16
Upper Air Station Model
A simplified station model T Temperature
(Celsius) DD Dew Point Depression Z Height of
the constant pressure surface dd Wind
Direction (degrees) ff Wind Speed (knots)
17
Upper Air Station Model
A station model EXAMPLE Temperature -21 C Dew
Point Depression 10 C Height 5460 m Wind
Direction North -- 00 Degrees Wind Speed 50
knots
18
Upper Air Station Model
- Height of pressure surfaces
- 850 mb
- 1100 - 1800 m
- Recorded as 100 - 800 with the leading 1
omitted - 700 mb
- 2700 - 3500 m
- Recorded as 700 - 500 with the leading 2 or 3
omitted
19
Upper Air Station Model
- Height of pressure surfaces
- 500 mb
- 4700 - 6000 m
- Recorded as 470 - 600 with the trailing 0
omitted - 250 mb
- 9000 - 11000 m
- Recorded as 900 - 1110 with the trailing 0
omitted
20
250 mb Upper Air