
INSTRUCTIONAL STRATEGIES THAT WORK - PowerPoint PPT Presentation
1 / 39
Title:
INSTRUCTIONAL STRATEGIES THAT WORK
Description:
INSTRUCTIONAL STRATEGIES THAT WORK. Data Disaggregation and Analysis ' ... Tom, Kris. Teacher A 2 students Gabe, Alta. Teacher F 1 student Mary. FIFTH GRADE ... – PowerPoint PPT presentation
Number of Views:276
Avg rating:3.0/5.0
Title: INSTRUCTIONAL STRATEGIES THAT WORK
1
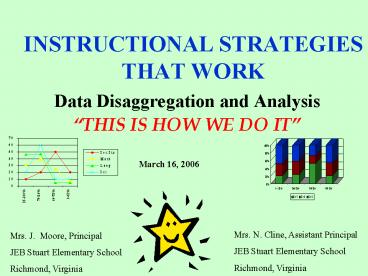
INSTRUCTIONAL STRATEGIES THAT WORK
- Data Disaggregation and Analysis
- THIS IS HOW WE DO IT
March 16, 2006
Mrs. N. Cline, Assistant Principal JEB Stuart
Elementary School Richmond, Virginia
Mrs. J. Moore, Principal JEB Stuart Elementary
School Richmond, Virginia
2
INTRODUCTION
- J. E. B. Stuart Elementary School
- Richmond, VA
- Jennifer Moore
- Principal
- Nancy Cline
- Assistant Principal
Stuart Stars
3
Unscramble
- ______________ is key to the success of No Child
Left Behind. - ______________ is why we collect and analyze
data. - ______________ is what drives us to excellence.
4
AGENDA
- Introduction
- Objectives for Presentation
- Research-based Strategy Data-Driven
Decision-Making - Benefits to our School
- Implementation at our School
- Final Thoughts and Summary
5
OBJECTIVES
- To review some of the research that supports data
driven decision making in schools and benefits - Options for collecting and presenting
student-achievement data - To ensure that the data is appropriate for daily
as well as strategic decision-making - To ensure that data is being collected and
utilized at all levels for data-driven decision
making - To identify opportunities to become more
effective as well as efficient in the utilization
of student-achievement data - Our implementation, preliminary findings and
next steps
6
SUCCESS
AT J. E. B STUART ELEMENTARY SCHOOL
We have wonderful students and a wonderful
staff We know what to do . . . . . SOL content
We know how to do it . . . Instructional
Toolkit We know when to do it . . . Pacing
Guide We know how to validate success . .
. with assessments and data analysis
7
ASSESSMENTS
. . . should always have more to do with
helping students grow than with compiling
and categorizing their mistakes
8
ASSESSMENTS Benefits to our School
- This is how we do it
- closing student achievement gaps (NCLB)
- Use assessments as a diagnostic tool to improve
student achievement - Understand curriculum scope and
sequence - Plan and design instruction
- Determine the RE-TEACH decision
- Determine the REMEDIATION decision
9
DATA ANALYSIS
- Utilize data disaggregation and data analysis to
identify student needs
- Process is in place for analyzing data bi-weekly
- Data are disaggregated at the classroom level
- Need to analyze data in several different
ways - School level results
- Grade level results
- Classroom level results
- Student level results
- Item analysis on test
- Subgroups results
10
TYPES OF SCHOOL DATA COLLECTED
Demographics
Enrollment Attendance Dropout Rate Ethnicity Gende
r
Values and Beliefs Perceptions of Learning
Environment Attitudes Observations
Description of School Programs and Processes
Perceptions
School Processes
Standardized Tests Norm/Criterion Referenced
Tests Teacher Observations Authentic Assessments
Student Learning
Bernhardt, V.(1998). Data Analysis for
Comprehensive Schoolwide Improvement.
11
HOW DO WE MAKE SENSE OF THE DATA?
12
GETTING STARTED
- Creating Data Collection Forms
- Consider your districts requirements
- Simplicity and ease of use
- Other requirements unique to your school
- Manual process or spreadsheet
13
JEB STUARTS DATA COLLECTION FORMS
14
J E B STUART
ELEMENTARY SCHOOL
BI-WEEKLY ASSESSMENT DATA COLLECTION FORM
Teacher ____________________________ Grade
______ Subject ______________ Month_______
Yr _______ WEEK ___ date _____________
SOL(s) ________________________
____ Essential Knowledge and Skills
__________________________________________________
________________________
________________________________________________
__________________________________________________
___ __________________________________________
__________________________________________________
_________ Name of test _________________________
_ Total Students Tested _________
Number 80 100 _______ ______
Number 61 79 ______ ____
Number 60 below _____ ______ INSERT NAMES
OF STUDENTS BELOW
Date Time of Reteaching
__________________________________________________
___________ Reassessing should immediately
follow reteaching and/or remediation.
15
WEEKLY GRADE LEVEL MEETING
- Data Disaggregation and Analysis Discussion
- Incorporate knowledge
- in customizing
- instruction
16
MONTHLY SCHOOLWIDE DATA MEETING
- Data Disaggregation and Analysis Discussion
- Lesson learned and sharing across all grades, K-5
with VA SOL subjects Language, Math, Science,
Social Studies
17
J E B STUART ELEMENTARY SCHOOLData
Disaggregation for period of ___________ ,
2005Schoolwide Information by Subject
(Cumulative for all Grades)
- Comments on data
- o Science SOLs objectives
need - re-teaching
- o A few math students
- may need remediation
- o Lang SS need further
- analysis such as
- item analysis
18
J E B STUART ELEMENTARY SCHOOLData
Disaggregation for week of ____________,
2006Subject Within Grade Level
- MATH
- SpEd Teacher pullout, reteach, modify test
- Remediate 2 students
- (math coach)
- Reteach small groups
- modified test (SpEd teacher)
Note Opportunity to learn from teacher of Class B
19
J E B STUART ELEMENTARY SCHOOLData
Disaggregation for week of _____________,
2005Subject Within Grade Level
- SOCIAL STUDIES
- SpEd Teacher review and reteach ( 1 student)
- Remediate 2 students
- Re-teach topics
20
MATHEMATICS REMEDIATION LIST
21
READING REMEDIATION LIST
22
DISTRICT LEVEL BENCHMARK TEST
- Validation of our instructional strategies
- Beginning of Year Benchmark
- Quarterly Benchmark Assessments
- End of Year Benchmark Assessments
- Review all data and findings at weekly and
monthly meetings - VA SOL Test the ultimate validation !
23
J E B STUART ELEMENTARY SCHOOLData
Disaggregation for 2005-2006 Benchmark
Assessment
Grade Level Information by Subject
GRADE 2
AVG CORRECT
24
COMPANION ASSESSMENT TOOLS
- EduTest and EduSoft
- Use to create test to complement instruction
- Use to assess essential skills
- Use to grade quarterly district benchmark
assessment - A variety of reports to aid in the analysis of
students achievement against SOLs
25
EduTest Example
26
EduSoft Example
27
EduSoft Example
28
EduSoft Example
29
SHARING OUR DATA with the District
- Charting the Course
- Collection of school information on RPS goals
- Improve Student Achievement
- Provide a Safe and Nurturing Environment
- Provide Strong Leadership
- Enhance Capacity Building thru Professional
Development - Strengthen Collaboration with Stakeholders
- Increase Parent and Community Involvement
- Opportunity for self-assessment and
self-correction - Consultation provided by RPS Administrative Team
- Balanced Scorecard
30
It Takes An Academic Village
- The District
- Awareness
- Translation and Interpretation
- Facilitating Change
- The Schools
- Implementation more specific to building needs
- The Teachers
- More specific to individual teacher and their
classroom needs - The Parents
- Understand process, their role, receive student
data, kept in the loop
31
FINAL THOUGHTS
- A lot of work to do to assist our students in
- Data-driven decision-making
- Time management
- Prioritization
- Working smarter
- Next Steps for us
- Broaden our data collection to include multiple
measures
Moving From Good to GREAT
32
SUMMARY
VA SOL Tests
33
EFFECTIVE USE OF SCHOOL DAY
- Lunch time review Use lunch time to review
learned material keep it fun give prizes,
snacks, etc. - Everyone teaches Principal, AP, Counselor,
everyone takes a group - Rearrange grouping and teachers Use data to
arrange students with like skills on certain SOLs
then have teachers use part of the day to work
with groups. - Rearrange school schedule Put more time into
areas that need more remediation Reading and
Math
34
?
Questions
35
(No Transcript)
36
(No Transcript)
37
GRADE LEVEL DATA
38
(No Transcript)
39
J E B S T U A R T ELEMENTARY SCHOOLData
Disaggregation for week of ____________, 2005
Grade Level Information by Subject
KINDERGARTEN
PERCENTAGE
Recommended
CrystalGraphics Presentations


