
Analysis of Variance - PowerPoint PPT Presentation
1 / 18
Title:
Analysis of Variance
Description:
score = mean score ( 0) Model 0. score = mean ... On-line readings: Judd et al (1995) - data analysis. Baron & Kenny (1986) - moderator and mediator variables. ... – PowerPoint PPT presentation
Number of Views:72
Avg rating:3.0/5.0
Title: Analysis of Variance
1
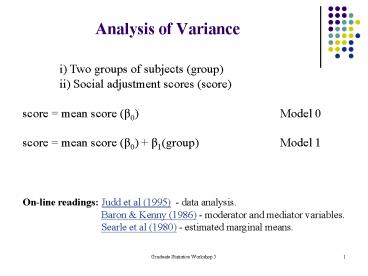
Analysis of Variance
i) Two groups of subjects (group) ii) Social
adjustment scores (score) score mean score
(ß0) Model 0 score mean score (ß0)
ß1(group) Model 1 On-line readings Judd et
al (1995) - data analysis. Baron Kenny
(1986) - moderator and mediator variables.
Searle et al (1980) - estimated marginal means.
2
Analysis of Variance Model
- observed response expected response error
- observed response overall mean group effect
error - y µ ? ?
- score mean score (ß0) ß1(group)
3
Social Adjustment versus Group
Overall mean 22.75
4
ANOVA Table
Tests of Between-Subjects Effects Dependent
Variable ADJUST Source Sum of
Squares df Mean Square F Corrected
Model 114.083 1 114.083 12.652 Intercept 6210
.750 1 6210.750 688.808 GROUP 114.083 1 114.0
83 12.652 Error 90.167 10 9.017
Total 6415.000 12 Corrected
Total 204.250 11
5
ANOVA versus Linear Regression
ANOVA Source Sum of Squares df Mean
Square F Corrected Model 114.083 1 114.083 12.
652 Intercept 6210.750 1 6210.750 688.808 GROU
P 114.083 1 114.083 12.652 Error 90.167 10
9.017 Total 6415.000 12
Corrected Total 204.250 11
Linear Regression Model Sum of
Squares df Mean Square F Regression 114.083 1 11
4.083 12.652 Residual 90.167 10 9.017
Total 204.250 11 indicates statistically
significant
6
Analysis of Covariance (ANCOVA)Covariate age
score ß0 Model 0 score ß0
ß1age Model 1 score ß0 ß1age
ß2group Model 2
7
ANCOVA
Source Sum of Squares df Mean Square F Sig.
Corrected Model 132.329 2 66.165 8.280 .009
Intercept 7.917 1 7.917 0.991 .346
AGE 18.246 1 18.246 2.283 .165 GROUP
5.805 1 5.805 0.726 0.416 Error
71.921 9 7.991 Total 6415.000 12
Corrected Total 204.250 11
8
Linear Regression
SS delta-SS df MS F MODEL
0 204.25 11 (mean) 126.52 1 126.52 126
.52/7.77 16.28 MODEL 1 77.73 10 7.77 (meana
ge) 5.81 1 5.81 5.81/7.99
0.73 MODEL 2 71.92 9 7.99 (meanagegroup)
9
ANOVA Models/Designs
One-Way ANOVA (work5a) For example One factor
(a) with 6 levels (a1 a6) where separate groups
of subjects (Gp1 Gp6) are tested under each of
the six levels.
10
ANOVA Models/Designs
Two-Way - Completely Randomised (work5b) For
example Two factors (a, b) with 3 levels of a
and 2 levels of b. Separate groups tested under
every combination of levels.
11
Mixed Model (Repeated Measures)
Two-Way Mixed-model (work5c) For example Three
separate groups of subjects where each group is
given only one level of factor a, whereas all
groups are given all levels of factor b.
Group 1 Group2 Group3 a1 a1 a2 a2 a3 a3 b1 b
2 b1 b2 b1 b2 72 62 66 51 40 50 55 61 40 44 59 49
51 29 54 44 50 52 65 49 43 30 2
5 54
12
Fully Repeated Measures
Two-Way Repeated measures (work5d) For example
One group of subjects/participants exposed to all
levels of factor a and factor b. a1 a1 a2 a2 a3
a3 b1 b2 b1 b2 b1 b2 s1 72 62 66 51 40 50 s2 55 6
1 40 44 59 49 s3 34 46 35 63 54 47 s4 51 29
54 44 50 52 s5 65 49 43 30 25 54
13
SPSS EMMEANS(SPSS Syntax Estimated Marginal
Means)
Two-Way - Completely Randomised (e.g. work5b)
EMMEANS displays estimated/predicted marginal
means of the dependent variable in the cells,
i.e. the population marginal means are estimated
based upon the experimental design and
statistical model. The estimated marginal means
will not always equal the observed means - see
Searle et al (1980).
14
SPSS SYNTAX
- UNIANOVA
- response BY conda condb
- /METHOD SSTYPE(3)
- /INTERCEPT INCLUDE
- /CRITERIA ALPHA(.05)
- /DESIGN conda condb condacondb.
15
ANOVA TABLE
16
SPSS SYNTAX
- UNIANOVA
- response BY conda condb
- /METHOD SSTYPE(3)
- /INTERCEPT INCLUDE
- /CRITERIA ALPHA(.05)
- /EMMEANS TABLE(conda condb) compare(conda)
- /DESIGN conda condb condacondb .
17
SPSS EMMEANS(SPSS Syntax Estimated Marginal
Means)
In this case the estimated marginal means will
equal the observed means sinceeach cell has
equal n and there are no missing cells, i.e. it
is balanced.
18
SPSS Pairwise Comparisons
Recommended
CrystalGraphics Presentations


