
Maximum Likelihood "Frequentist" inference - PowerPoint PPT Presentation
Title:
Maximum Likelihood "Frequentist" inference
Description:
Maximum likelihood estimates of the model parameters and 2 are numbers that ... Empirical Bayes 'inflates variances' from the low-variability genes ... – PowerPoint PPT presentation
Number of Views:120
Avg rating:3.0/5.0
Title: Maximum Likelihood "Frequentist" inference
1
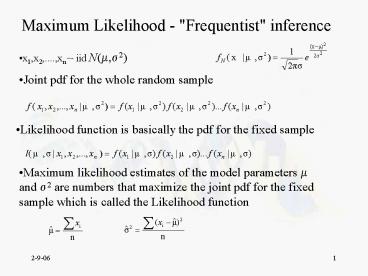
Maximum Likelihood - "Frequentist" inference
- x1,x2,....,xn iid N(?,?2)
- Joint pdf for the whole random sample
- Likelihood function is basically the pdf for the
fixed sample
- Maximum likelihood estimates of the model
parameters ? and ?2 are numbers that maximize the
joint pdf for the fixed sample which is called
the Likelihood function
2
Sampling Distributions
- x1,x2,....,xn iid N(?,?2)
3
"Frequentist" inference
- Assume that parameters in the model describing
the probability of experimental outcome are
unknown, but fixed values - Given a random sample of experimental outcome
(data), we make inference (i.e. make
probabilistic statements) about the values of the
underlying parameters based on the sampling
distributions of parameter estimates and other
"sample statistics" - Since model parameters are not random variables,
these statements are somewhat contrived. For
example we don't talk about the p(?gt0), but about
p(tgtt?0). - However, for simple situations this works just
fine and arguments are mostly philosophical
4
Bayesian Inference
- Assumes parameters are random variables - key
difference
- Inference based on the posterior distribution
given data - Prior DistributionDefines prior knowledge or
ignorance about the parameter - Posterior DistributionPrior belief modified by
data
5
Bayesian Inference
6
Bayesian Estimation
- Bayesian point-estimate is the expected value of
the parameter under its posterior distribution
given data
- In some cases, the expectation of the posterior
distribution could be difficult to assess - easer
to find the value for the parameter that
maximized the posterior distribution given data -
Maximum a Posteriori (MAP) estimate - Since the numerator of the posterior distribution
in the Bayes theorem is constant in the
parameter, this is equivalent to maximizing the
product of the likelihood and the prior pdf
7
Alternative prior for the normal model
- Degenerate uniform prior for ? assuming that any
prior value is equally likely - this is clearly
unrealistic - we know more than that
- MAP estimate for ? is identical to the maximum
likelihood estimate - Bayesian point-estimation and maximum likelihood
are very closely related
8
Hierarchical Bayesian Models and Empirical Bayes
Inference
- MOTIVATION
- xij ind N(?j,?j2), i1,...,n is number of
replicated observations and j1,...,T is indexing
all genes - Each gene has its own mean and variance
- Usually n is small in comparison to T
- Want to use information from all genes to
estimate the variance of individual gene
measurements
9
Hierarchical Bayesian Models and Empirical Bayes
Inference
- SOLUTION
- Postulate the "hierarchical" Bayesian model in
which individual variances for different genes
are assumed to be generated by a single
distributions
- Estimate the parameters of this distribution
using the Empirical Bayes approach - Estimate individual gene's variances using
Bayesian estimation assuming the prior parameters
calculated using Empirical Bayes
10
Hierarchical Bayesian Models and Empirical Bayes
Inference
- Testing the hypothesis ?i0, by calculating the
modified t-statistics
- Limma operates on linear modelsyj X?j ?j,
?1j,...,?nj N(0,?j2)and the Empirical Bayes
estimation is applied to estimate ?2for each gene
11
Effects of using Empirical Bayes modifications
gt attributes(FitLMAD) names 1 "coefficients"
"stdev.unscaled" "sigma"
"df.residual" "cov.coefficients" 6
"pivot" "method" "design"
"genes" "Amean"
class 1 "MArrayLM" attr(,"package") 1
"limma" gt attributes(EFitLMAD) names 1
"coefficients" "stdev.unscaled" "sigma"
"df.residual" "cov.coefficients" 6
"pivot" "method" "design"
"genes" "Amean" 11
"df.prior" "s2.prior" "var.prior"
"proportion" "s2.post" 16
"t" "p.value" "lods"
"F" "F.p.value"
class 1 "MArrayLM" attr(,"package") 1
"limma"
12
Effects of using Empirical Bayes modifications
gt EFitLMADs2.prior 1 0.03466463 gt
EFitLMADdf.prior 1 4.514814
13
Effects of using Empirical Bayes modifications
- gt AnovadBs2.prior
- 1 0.0363576
- gt AnovadBdf.prior
- 1 5.134094
- Empirical Bayes "inflates variances" from the
low-variability genes - This reduces the proportion of "false positive"
resulting from the low variance - It biases chance of being differentially
expressed towards genes with higher observed
differential expressions - It has been shown to overall improve the
proportion of true positives among the genes
pronounced significant - "Stein effect" - individually we can not improve
over the simple t-test, but by looking at all
genes at the same time, turns out that this
method works better
14
Effects of using Empirical Bayes modifications
gt AnovadBs2.prior 1 0.0363576 gt
AnovadBdf.prior 1 5.134094
15
Effects of using Empirical Bayes modifications
gt AnovadBs2.prior 1 0.0363576 gt
AnovadBdf.prior 1 5.134094